
The briefing
The client was a big transports company, this consultancy had the objective of solving intermittent deadlocks on a SQL Server 2008, when those deadlocks occurred in transactions, money, company image and employees time would be lost.
The application that manipulated this database was written as Vb.net running as COM+. Yes, COM+, I didn’t know what was this as well, it is a technology for running your application as software components that had been introduced by Microsoft in 1993. Wikipedia
The company was in a close city to Sao Paulo — Brazil, so I took the bus early in the morning and went there. On my first day at the company, my deadlock knowledge very basic, I knew what was the concept, but I had no idea on the details of locking of the database engine.
Initial investigation
I started by asking the developers about what they thought it could be the cause of the deadlocks, I’ve got: “It is the database fault”, and you could guess the answer of the DBA’s was simple “It is the application fault”.

The DBA showed me the existing SQL Profiler sessions from times of deadlocks occurred, there were normal queries, but there wasn’t anything too obvious on why the deadlocks were occurring.
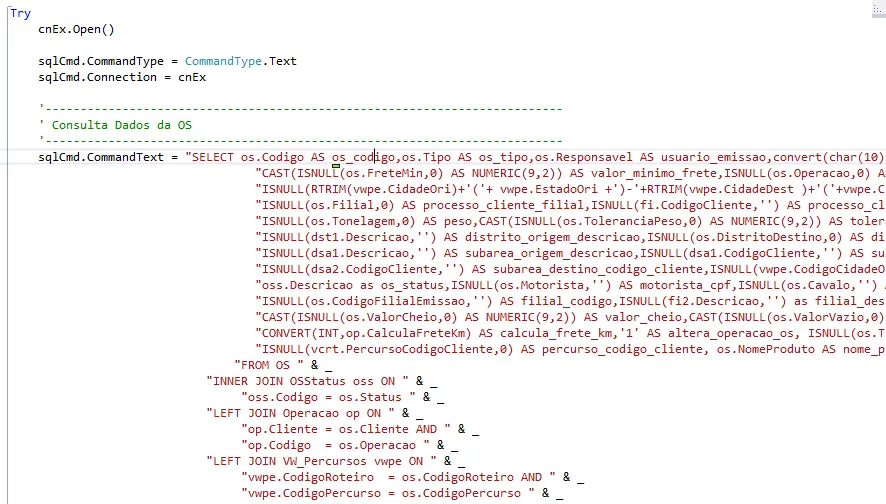
My first rounds of investigations was a brief look at the code. From which I found some really bad practices that would waste application memory, network usage and had low maintainability as:
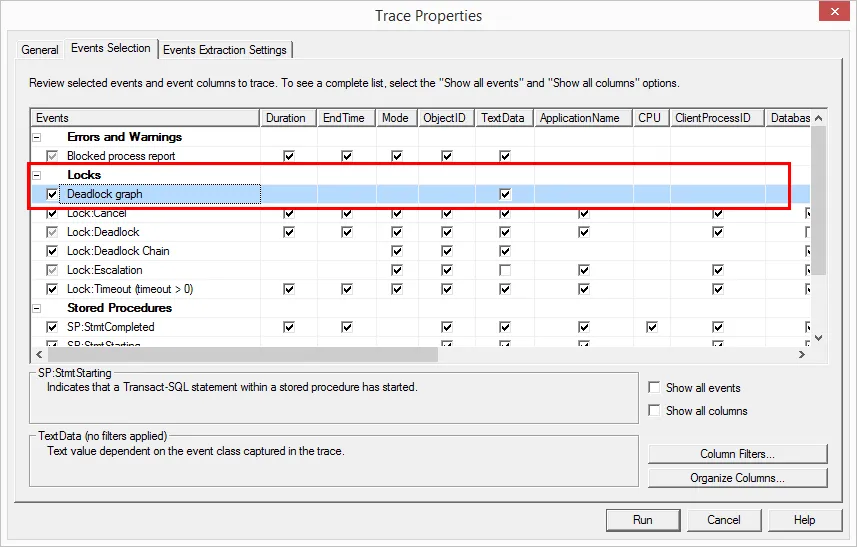
But still, I was not a single step closer to the deadlocks, so I went home and watched a Pluralsight course about deadlocks on the bus back and at home. That gave me all the tools I needed for solving this problem as it taught me the types of locks used by SQL , their granularity and especially how to capture a visual representation of deadlocks using SQL Profiler ( graph event).
The graphs the SQL Profiler gave me for almost all the deadlocks were similar to this:
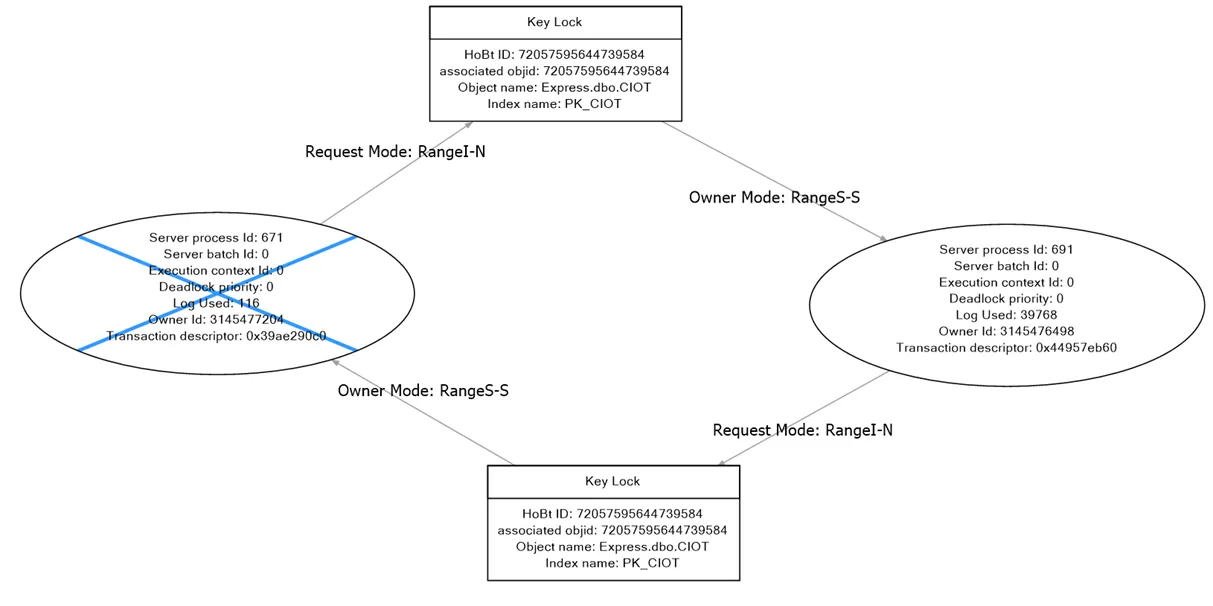
Very good representation isn’t it? Not only it draws for you who is blocking what, but it also gives the type of locks that conflicted. What was strange on the diagnostic is this “Request Mode: RangeS-S”, that means a key range shared lock. Why are we getting such a lock?
Here is the MSDN documentation on Key-range:
Protects the range of rows read by a query when using the serializable transaction isolation level. Ensures that other transactions cannot insert rows that would qualify for the queries of the serializable transaction if the queries were run again.
In case you don’t know what the transaction isolation level defines:
Transactions specify an isolation level that defines the degree to which one transaction must be isolated from resource or data modifications made by other transactions. Isolation levels are described in terms of which concurrency side-effects, such as dirty reads or phantom reads, are allowed.
Remember the lock we got on the deadlock graph is from a Serializable transaction level, this is the definition:
On the same MSDN link you can see the other types of transaction level:
All right, still very strange, why was the transaction using the most restrictive transaction isolation level? I showed my finding to the DBAs and they still blamed the application. I asked the developers and they blamed the database.
So we checked the default isolation level in the database and it was as “ReadCommited”, which was all right. So my scope was why some transactions were as serializable?
I had an epiphany and remembered we were using COM+, so I googled “COM+ default transaction isolation level” and got this:
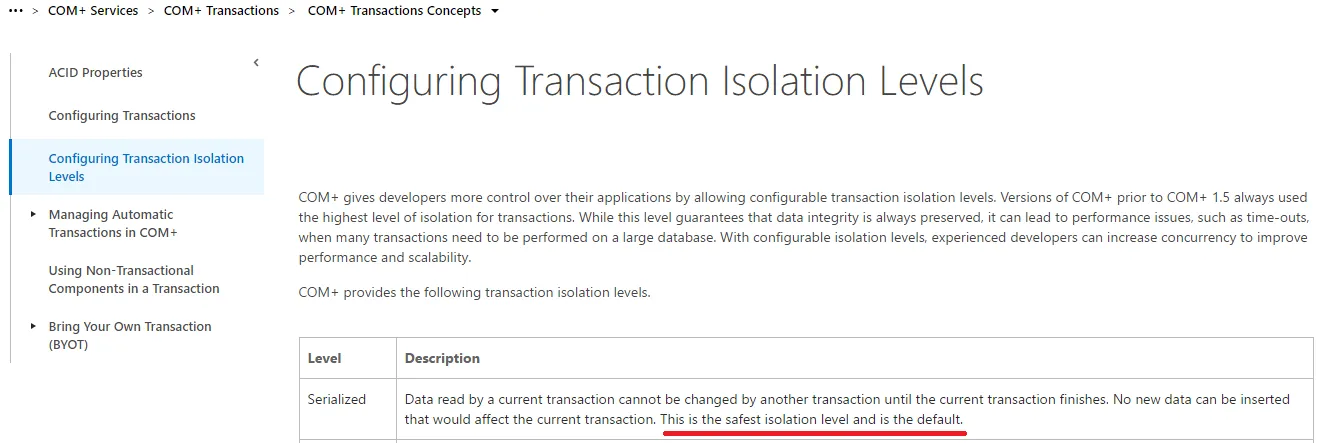
So it was just the default isolation level of COM+. Moving to a different isolation level than the default stopped the deadlocks that were occurring as now the locks were not so restrictive.
Conclusion
Hopefully, here you got one of your first exposures into a bit of the internals of transaction levels, locking in SQL Server and also on how to capture deadlock events if needed.
Sometimes issues fall across the borders of different roles, in this case between the DBAs and developers. I believe a more collaborative attitude can help you cross the boundaries to solve the issue for your company.