From "Lump Sum" to "Line Item"
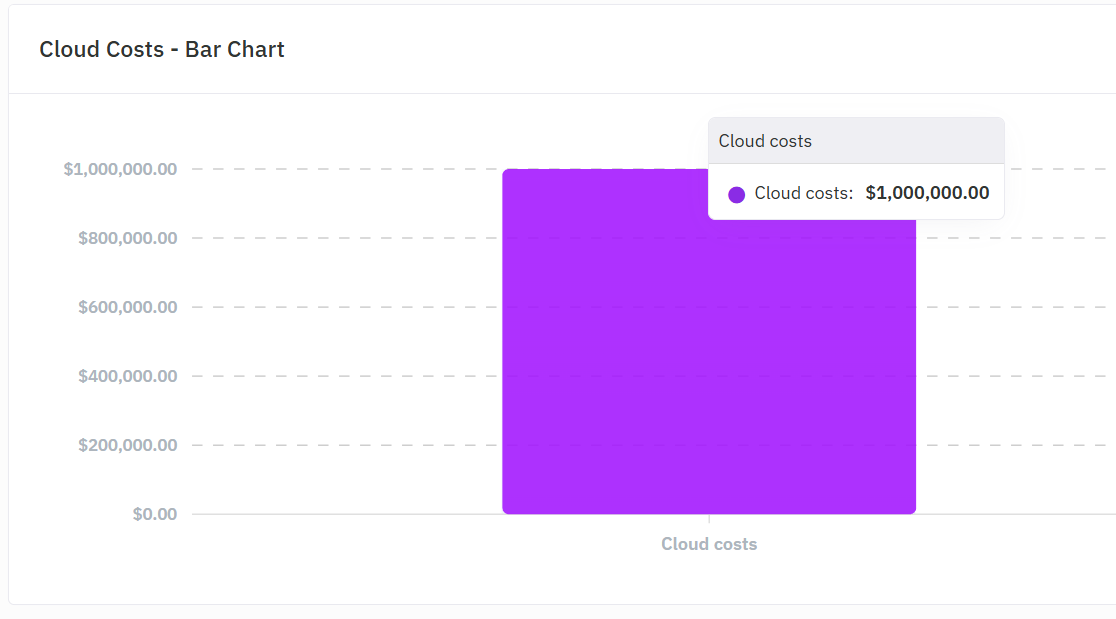
You can imagine your $1,000,000 monthly cloud bill arrives. It's a single, monolithic bar labelled "Cloud Infrastructure: $1,000,000." To a CFO, this is a "Black Box." You know the money is gone, but you don't know if it was spent growing the business or just keeping the lights on.
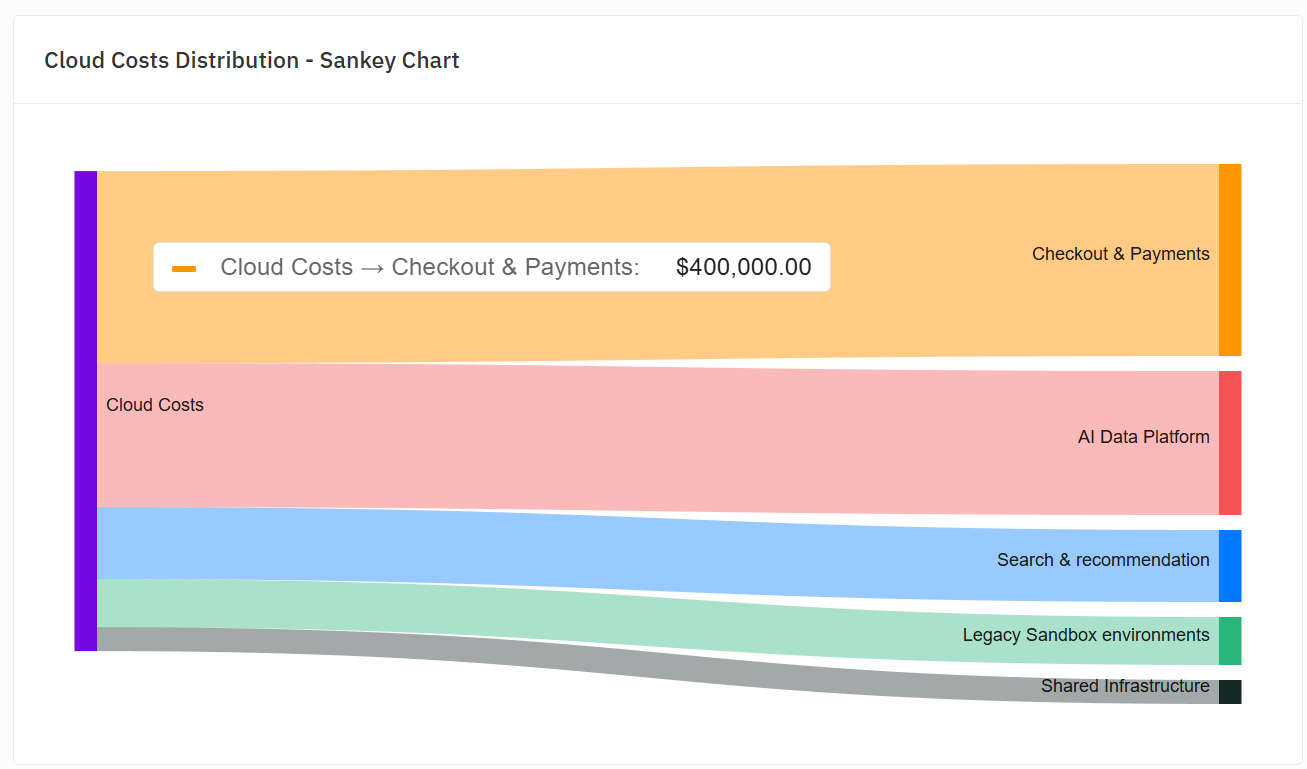
Now, imagine transforming that single bar into this Chart for an example e-commerce platform.
Suddenly, that $1,000,000 starts to tell a story:
- Product Attribution: You see that $400,000 went to the "Checkout & Payments" engine. If revenue is up 20% this month, that's a healthy investment.
- Team Accountability: You see $150,000 flowing into the "Search & Recommendation" team. Now you can measure the ROI of that team's latest AI deployment.
- Waste Identification: You notice $100,000 flowing into "Legacy Sandbox Environments" that haven't been touched in six months. That's an immediate, data-backed saving.
- Operational Health: You see $50,000 in "Shared Infrastructure" (like networking or security) prorated across all departments, giving you a true cost-to-serve for every customer order.
Why This Matters for the Board
When you move from a lump sum to granular allocation, the conversation changes:
- The CEO stops asking "Why is the bill so high?" and starts asking "Which product line has the best cloud margins?"
- The CFO stops guessing on next year's budget and starts forecasting based on expected customer growth and unit costs.
- The CTO stops defending the tech stack and starts demonstrating how engineering efficiency directly impacts the bottom line.
Visibility is the First Step
In the FinOps Inform Phase, visibility isn't just about having another dashboard; it's about having business context. Without tagging costs by product, team, or department, you aren't managing your cloud; you're just paying for it.
While visibility is vital for the board, its most transformative power is felt at the engineering level. When we push granular cost data down to the individual product teams, we move from centralised costs to distributed accountability.
For the teams on the ground, knowing their own costs provides:
A New Definition of "Efficiency"
Traditionally, an engineer's success is measured by uptime and velocity. Granular visibility adds a third dimension: unit economics. Instead of just "Does the feature work?", the metric becomes "Does the feature work profitably?"
Data-Backed Prioritisation
When a team can see that a specific microservice costs $5,000 a month and is called by only 1% of users, they don't need a manager to tell them to consider decommissioning it. The data makes the "technical debt" vs. "new feature" trade-off objective rather than emotional.
The Gamification of Optimisation
Engineers are natural problem solvers. By providing a dashboard that shows the direct impact of their architectural choices. You turn cost-saving into a measurable engineering challenge.
Why Koritsu.ai?
Koritsu.ai bridges the gap between raw cloud data and executive-level insights. We help you move past the "lump sum" era by first defining a custom tagging strategy tailored to your business structure, moving beyond basic "Name" tags to define business-critical dimensions such as Product, Environment, Team, and Cost Centre.
We also help with automating the process to eliminate manual errors and account for complex shared costs.
With our SaaS AI platform, you gain a real-time view of your Allocation Percentage, allowing you to validate exactly how much of your spend is mapped to specific business outcomes. We don't just show you what you're spending, we provide the framework to ensure every dollar is accounted for and optimised.
"Are your costs granular enough?"