FinOps Inform · Cost Visibility
Build an internal cloud cost dashboard: FinOps guide
Learn how to build an internal cloud cost dashboard. This FinOps guide covers essential steps for finance, engineering, and executive insights.

The goal is a reconciled canonical dataset feeding role-based dashboards for finance, engineering, and executives, refreshed daily and wired to anomaly detection. That is the end state. The minimal pipeline to get there: cloud billing exports flow into an ingestion layer, transforms normalise everything to a FOCUS-compatible schema, the canonical data lands in a central warehouse or metrics store, and a visualisation layer serves each stakeholder the view they actually need.
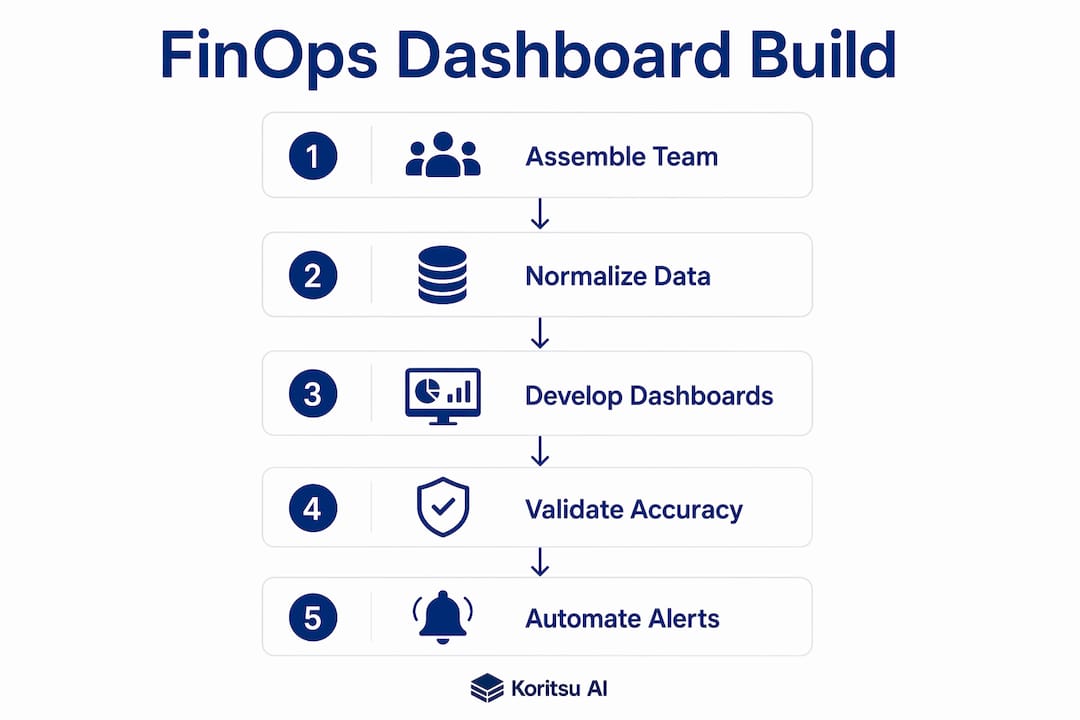
Your first few days look like this. Assemble your core group: a FinOps lead, a finance analyst, and an SRE or platform engineer. Enable billing exports on every provider (AWS Cost and Usage Report, GCP billing to BigQuery, Azure Cost Management exports). Build a minimal extract-transform-load pipeline into a central store. Surface a one-page finance dashboard showing overall spend, major cost sources, and reservation coverage. That single view, validated against your invoices, is your proof of concept and your political capital for the wider rollout.
The quick wins that matter in week one: identify your major spend sources, validate that your reservation and savings plan commitments are being applied correctly, and confirm that at least one business unit can see its own costs without asking FinOps for a spreadsheet.
Which billing and usage exports do you need to ingest?
Every cloud provider structures its billing data differently. The first job is knowing exactly what to pull and why.
- AWS: enable the Cost and Usage Report (CUR) with line-item granularity and resource-level tags. CUR is the most detailed export AWS produces and the only one that exposes reservation and savings plan adjustments at the line-item level. Store it in S3 and ingest from there.
- GCP: export detailed billing to BigQuery. This gives you resource labels, SKU-level pricing, and the ability to run SQL directly against billing lines without any intermediate extract step.
- Azure: configure Cost Management exports with usage details at the daily granularity. The schema index for Azure exports is documented by Microsoft and covers all fields you need for allocation.
- SaaS and marketplace: pull invoices or usage exports from central procurement for tools like Datadog, Harness, Snowflake, or any other significant subscription. Normalise these into the same canonical store so your dashboard reflects total cloud-related spend, not only IaaS and PaaS.
Line-item exports are non-negotiable for accurate allocation and anomaly detection. Summary exports are useful for executive views but hide the resource-level detail that lets you attribute costs to a team or investigate a spike. The essential metadata to capture on every line: account or project identifier, resource identifier, SKU or service code, timestamp, usage amount and unit, tags or labels, currency, and invoice identifier.
Pro Tip: Capture reservation, savings plan, and committed-use discount line items separately and record the effective discount at the invoice line level. Failing to do this leads to double-counting credits or missing them entirely when you aggregate by business unit.
How to normalise multi-cloud data into a canonical schema
Raw exports from AWS, Azure, and GCP use different field names, different granularities, and different conventions for representing discounts. Without a canonical schema, every cross-cloud comparison becomes a manual reconciliation exercise.

The FOCUS specification (FinOps Open Cost and Usage Specification) is the industry standard for this. It defines a common schema so identical metrics, compute cost, for instance, can be compared across providers using a single field definition. Teams that build per-provider mapping without adopting FOCUS typically refactor to it later anyway, once the inconsistencies compound. Adopting FOCUS early prevents that repeated rework.
The canonical field list your transforms should produce:
| Canonical field | Description |
|---|---|
| date | Usage date (UTC, aligned to invoice period) |
| provider | AWS, GCP, Azure, or SaaS vendor name |
| account_id | AWS account, GCP project, Azure subscription |
| resource_id | Resource-level identifier from provider |
| cost_type | Usage, tax, credit, adjustment, commitment |
| service_category | Compute, storage, network, database, etc. |
| usage_amount | Quantity consumed |
| unit | Hours, GB, requests, etc. |
| effective_cost | Post-discount, post-credit cost |
| currency_original | Provider invoice currency |
| fx_rate | Exchange rate at invoice date |
| effective_cost_gbp | Converted GBP cost for UK reporting |
| allocation_key | Tag or label used to assign cost |
| business_unit | Mapped organisational unit |
| environment | Production, staging, development |
| invoice_id | Invoice or billing period identifier |
A concrete AWS CUR mapping example: lineItem/UsageStartDate maps to date; product/ProductName maps to service_category; lineItem/UnblendedCost maps to effective_cost before discount adjustments; resourceTags/user:Team maps to business_unit. Keep the original provider fields in an immutable raw layer and apply transforms in versioned views so you can audit and replay any allocation change.
For UK reporting, always capture the original invoice currency alongside the exchange rate and the GBP equivalent at invoice date. Do not convert at query time using a live rate; that produces inconsistent month-over-month figures when rates shift.
What should each stakeholder's dashboard show?
Mapping costs to business units rather than only provider tags is what turns a reporting tool into a governance instrument. Finance understands cost centres; engineering understands tags. The dashboard layer must speak both languages.
Finance dashboard
- Monthly burn vs budget by business unit and provider
- Forecast vs budget with variance flag
- Realised savings from reservations and savings plans
- Vendor commitment utilisation and expiry calendar
- Invoice reconciliation status (confirmed vs provisional)
Engineering and DevOps dashboard
- Cost per service and cost per environment (production vs non-production)
- Top 10 cost drivers by absolute GBP, updated daily
- Anomaly feed with contextual metadata (resource, service, BU, nearest deployment)
- Reservation and savings plan coverage percentage by compute family
- Cost per unit of business (requests, transactions, active users)
Executive dashboard
- Cross-cloud total spend with trend line and 90-day forecast
- Commitment utilisation summary
- Top three cost-reduction opportunities surfaced by FinOps
- Budget status by business unit, traffic-light format
On showback versus chargeback: showback shows each business unit what it consumed without transferring the cost in the general ledger. Chargeback does transfer it. Both require the same underlying allocation model; the difference is whether finance posts journal entries. Start with showback. It builds trust in the data before anyone is financially accountable for it.
Widget recommendations that work across all three views: time series with burn and forecast overlay, stacked bar breakdowns by service category, top-N tables by absolute GBP, anomaly lists with metadata, and a utilisation heatmap for reservation coverage or rightsizing candidates.
Which tools and platforms should you use?
The choice of tooling comes down to five questions, not vendor marketing.
- How fresh does the data need to be? Daily refresh covers the majority of finance and FinOps use cases. Near-real-time ingestion adds engineering complexity and cost; reserve it for operational anomaly detection on high-velocity workloads.
- Do you need to correlate costs with metrics and traces? If yes, an observability platform with a cost module (such as Datadog) or a self-hosted Grafana instance connected to both your metrics store and cost warehouse is the right direction.
- What is your internal engineering capacity? A warehouse-plus-BI approach (BigQuery with Looker Studio or Power BI) requires SQL and data engineering skills but gives maximum flexibility. Grafana on a metrics store is lighter to operate but less suited to ad-hoc financial analysis.
- Do you need templated role-based access out of the box? Harness Cloud Cost Management provides pre-built cost perspectives and RBAC without requiring a custom BI layer. Power BI and Looker Studio require you to build that access model yourself.
- What does hosted versus self-hosted cost you? BigQuery and Looker Studio carry query and storage costs that scale with data volume. Self-hosted Grafana is free to run but requires infrastructure and maintenance.
The warehouse-plus-BI approach (BigQuery plus Looker Studio, or a data warehouse feeding Power BI) suits teams that want flexible ad-hoc analysis, custom SQL reports, and forecasting models built on top of the canonical dataset. Observability platforms like Datadog are best when cost correlation with application telemetry is the primary requirement. Grafana works well for lightweight operational cost views where the team already runs a metrics stack. Harness accelerates the initial setup with pre-built cost perspectives but is less flexible for custom financial modelling.
Across all approaches: build reusable templates, parameterise filters by business unit, product, and environment, and save queries so the dashboard does not require a data engineer every time someone wants a new slice.
How to implement the dashboard in phases
- Discovery and scope: list every cloud account and subscription, identify the top five spenders by business unit, and confirm who owns each account. Assign a FinOps lead, a finance contact, and a platform engineer to the project.
- Enable exports and ingest raw data: activate CUR on AWS, BigQuery billing export on GCP, and daily Cost Management exports on Azure. Land raw files in an immutable storage layer (S3, GCS, or Azure Blob Storage).
- Implement canonical transforms to FOCUS: build versioned ETL or ELT jobs that map provider fields to the canonical schema. Store original fields alongside canonical ones for audit.
- Seed a minimal finance dashboard and validate against invoices: aggregate totals in the canonical table must match your cloud invoices. AWS Cost Explorer data refreshes within 24 hours but may differ from invoice totals due to timing and grouping differences; expect a 24–72 hour accuracy window before provisional usage fully reconciles to final invoice figures.
- Add role-based views and automate daily refreshes: build the finance, engineering, and executive dashboards. Schedule ingestion and transform jobs to run nightly.
- Enable anomaly detection and forecasting schedules: configure threshold-based alerts per business unit and add statistical anomaly detection on daily cost series.
- Organisation-wide rollout with training: onboard business unit leads, document the allocation model, and run a walkthrough session for finance and engineering teams.
Reconciliation checklist before going live: compare aggregate canonical totals to cloud invoices for the prior month; validate that reservation and savings plan adjustments appear as credits at the line-item level; spot-check five to ten resource mappings to confirm business unit attribution; verify GBP conversion accuracy against the exchange rates used in your finance system.
Responsibility matrix: FinOps owns governance, KPI definitions, and anomaly triage. Finance owns invoice validation and budget management. SRE or platform engineering owns export configuration, ingestion pipelines, and access controls. Business unit leads own acting on recommendations and maintaining tag compliance.
For testing: run end-to-end smoke tests after each ETL change, maintain a reconciliation test that compares canonical totals to a known invoice, and keep a rollback plan for any transform version that produces unexpected totals.
How do you link cost spikes to deployments and metrics?
A cost spike without context is just a number. The goal is to make every spike explainable within minutes, not hours.

The practical pattern: join cost events to your deployment and metrics timelines using resource identifiers, service names, or orchestration labels. Align by hourly or daily windows depending on your ingestion granularity. A daily cost table joined to a deployments table on service_name and date will surface the nearest deployment for most spikes without requiring sub-minute telemetry.
Annotating cost timelines with deployment events is straightforward if your CI/CD pipeline writes deployment metadata to a shared event table or directly to the cost store. A simple webhook from your deployment tool (GitHub Actions, ArgoCD, or similar) that records service_name, deploy_timestamp, commit_sha, and environment gives you the join key. When a cost spike appears in the dashboard, the annotation layer shows the nearest deploy, the nearest alert, and any traffic surge in the same window.
Cloud observability and cost correlation work best when naming conventions are consistent across teams. If one team tags their compute resources as service:payments and another uses app:payments-api, the join fails silently. Consistent naming is a governance problem, not a tooling problem.
A practical limitation: finer-grained correlation (hourly or per-request) requires richer telemetry tags and consistent resource naming across every team. Daily correlation is achievable immediately; sub-hourly correlation is a later-phase investment.
Governance, tagging, and budget enforcement
Dashboards drift into irrelevance when tagging is inconsistent and nobody is accountable for the data. Governance is what keeps the dashboard useful six months after launch.
Tagging policy checklist:
- Define required tag keys:
business_unit,product,environment,owner. These four cover the majority of allocation and accountability use cases. - Enforce tags at deployment time using infrastructure-as-code policies (AWS Service Control Policies, GCP Organisation Policies, Azure Policy). Do not rely on manual tagging.
- Run a monthly audit of untagged or mistagged resources. Report the percentage of spend covered by valid tags as a FinOps KPI.
- Set a target: 95% of spend attributable to a business unit within 90 days of launch.
Access control and RBAC: apply the principle of least privilege. Finance roles see cost and forecast data but not resource-level identifiers. Engineering roles see their own business unit's cost and anomaly data. Executives receive signed read-only links or embedded views with no ability to modify filters or access raw data. For the data warehouse layer, use row-level security in BigQuery, Power BI, or Looker Studio to enforce these boundaries at the query level, not just the UI level.
Budget and alerting recipe: set a budget per business unit in your canonical store, configure automated alerts at 80% and 100% of monthly budget, and layer anomaly detection to catch unusual spend between those thresholds. A spike that hits 40% of monthly budget in three days will not trigger a threshold alert but will trigger an anomaly alert.
Operational rituals that keep the dashboard alive: a monthly budget review with finance and BU leads, a weekly anomaly triage with FinOps and engineering, and a runbook for investigating and remediating cost leaks. The cloud spending governance framework for this kind of operational cadence is well-documented and worth formalising early.
Widget templates and a starter query
These widget types cover the majority of use cases across all three dashboard personas:
| Widget | Stakeholder | Primary metric |
|---|---|---|
| Daily burn time series | All | Effective cost GBP by day |
| Monthly forecast vs budget | Finance, Exec | Projected month-end vs budget |
| Top 10 cost drivers | FinOps, Engineering | Absolute GBP by service or resource |
| Cost per business unit | Finance, FinOps | Effective cost GBP by business_unit |
| Reservation coverage | FinOps, Finance | % of eligible compute covered by commitment |
| Anomaly stream | FinOps, Engineering | Flagged cost events with metadata |
| Cost per unit of business | Engineering, Exec | GBP per transaction, request, or active user |
| Environment breakdown | Engineering | Production vs non-production cost split |
| Commitment expiry calendar | Finance | Upcoming reservation and savings plan renewals |
A compact pseudo-SQL aggregation for daily cost by business unit from the canonical table:
SELECT
  date,
  business_unit,
  provider,
  service_category,
  SUM(effective_cost_gbp) AS total_cost_gbp
FROM canonical_cost
WHERE date >= DATE_TRUNC('month', CURRENT_DATE)
GROUP BY 1, 2, 3, 4
ORDER BY date, total_cost_gbp DESC;
For UK finance reporting, align the date field to GMT in winter and BST in summer. Month-end cutoff should match your invoice period, not the calendar day in UTC, which can shift the last day of the month by one hour. Parameterise every widget with filters for business_unit, product, and environment so teams can self-serve without requesting a new query.
When showing month-to-date figures alongside a forecast, be explicit about whether the forecast uses a linear run-rate or a model trained on historical seasonality. A run-rate forecast in a month with a bank holiday will overstate projected spend.
How Koritsu AI approaches internal cost dashboards
The pattern Koritsu AI uses combines continuous AI analysis via the Kori agent with human-in-the-loop recommendations, all surfaced through role-based dashboards that map directly to the architecture described above.
Three starter plays that Koritsu AI commonly deploys:
- Rapid export enablement and canonical seed: get all three provider exports live and a minimal FOCUS-mapped table in place within the first week. This single step unblocks every downstream analysis.
- Reservation and commitment reconciliation: audit every active reservation and savings plan against actual usage. Unused commitments are the most common source of recoverable spend.
- Targeted anomaly patrol for top-spend business units: focus anomaly detection on the two or three BUs that represent the majority of spend. Early wins here build trust in the dashboard and in the process.
Replacing manual exports and spreadsheets with a unified dashboard has been shown to reduce time spent on budget consolidation by up to 40%. That is the kind of operational gain that makes the build worthwhile beyond the cost savings themselves.
Koritsu AI operates on outcome-based pricing: a free assessment first, then a share of the savings actually found. If you want to accelerate the export, normalisation, and dashboard delivery phases, a free assessment is the logical starting point.
How to integrate forecasting models for cloud spend
Forecasting belongs in the same canonical model as actuals. Keeping them separate means finance teams are always reconciling two different data sources, which defeats the purpose of a unified dashboard.
The practical approach: train a forecasting model on your canonical effective_cost_gbp time series, segmented by business_unit and service_category. A simple linear regression on the trailing 90 days works for stable workloads. For workloads with seasonal patterns (end-of-month batch jobs, marketing campaign spikes), a model that accounts for day-of-week and month-of-year effects produces materially better estimates.
Forecast views should show projected spend and commitment utilisation together so executives and finance teams can see whether existing reservations will cover forecasted demand or whether new commitments are warranted. Surfacing a forecast without commitment context leads to purchasing decisions that ignore existing coverage.
Refresh forecasts on the same cadence as actuals, daily at minimum. A forecast that is three days stale during a cost spike is not useful for budget decisions. Store forecast outputs in the canonical table alongside actuals using a cost_type value of forecast so the same queries and dashboards can render both without schema changes.
Data privacy and compliance when aggregating cloud cost data
Cloud cost data contains more sensitive information than most teams realise. Resource identifiers can reveal product architecture; tag values often include team names, project codes, or customer identifiers. Aggregating this data into a central warehouse requires deliberate controls.
Under UK GDPR, cost metadata that can be linked to an individual (a named owner tag, a personal project identifier) is personal data and must be handled accordingly. The practical mitigation: pseudonymise owner tags at ingestion by mapping named individuals to role or team identifiers before the data enters the canonical store. Never store personal email addresses or employee identifiers in the cost warehouse without a lawful basis and appropriate retention controls.
For access control, apply the RBAC model described in the governance section at the data layer, not only the dashboard layer. Row-level security in BigQuery or Power BI ensures that a finance analyst querying the canonical table directly cannot access data outside their permitted scope. Audit logs on the warehouse should capture every query, not just dashboard views.
Retention policy: align cost data retention to your financial record-keeping obligations. UK companies are generally required to retain financial records for six years under HMRC rules. Configure your warehouse retention accordingly and document it in your data governance register.
If your cost data flows through a third-party BI tool or observability platform, confirm that the vendor's data processing agreement covers your use case and that data residency meets your requirements. For UK organisations post-Brexit, confirm whether data is processed within the UK or the EEA and whether standard contractual clauses are in place.
Managing SaaS and third-party subscription costs
IaaS and PaaS from AWS, GCP, and Azure typically represent the largest share of cloud spend, but SaaS subscriptions and marketplace purchases are growing fast and are often invisible in cost dashboards. Including them is not optional if you want total spend visibility.
The ingestion approach for SaaS: collect invoices or usage exports from your central procurement system or directly from vendors. Tools like Datadog, Harness, Snowflake, and similar platforms often provide usage-level exports via API or CSV. Normalise these into the canonical store using the same FOCUS-compatible schema, with provider set to the vendor name and service_category set to a standardised label (observability, data warehouse, security, and so on).
The allocation challenge with SaaS is that many subscriptions are enterprise-wide and not inherently attributable to a single business unit. The practical solution: define an allocation rule in the canonical transform layer. A Datadog subscription might be split by the number of hosts per business unit; a Snowflake contract might be split by query credits consumed per team. Document the allocation rule in the allocation_key field so finance can audit it.
Marketplace purchases made through AWS, GCP, or Azure appear in the provider billing export and can be ingested through the same pipeline. Flag them with a cost_type of marketplace to distinguish them from direct IaaS spend in your dashboards. This distinction matters for commitment planning: marketplace spend does not count against most reserved instance or savings plan commitments.
Key takeaways
A reconciled, FOCUS-normalised canonical dataset feeding role-based dashboards is the foundation of every effective internal cloud cost management system, and the first version can be live within 72 hours.
| Point | Details |
|---|---|
| Canonical data model first | Normalise all provider exports to FOCUS before building any dashboard to prevent repeated refactoring. |
| Map to business units, not only tags | Finance understands cost centres; tag-only views create allocation gaps and reduce accountability. |
| Validate against invoices | Reconcile canonical totals to cloud invoices before trusting any forecast or anomaly alert. |
| Role-based dashboards from day one | Finance, engineering, and exec views have different KPIs; one generic dashboard serves none of them well. |
| Koritsu AI accelerates the build | Koritsu AI's Kori agent and outcome-based model can compress the export, normalisation, and dashboard delivery phases significantly. |
The pitfalls that waste the most time
The most common mistake is building provider-specific ETL without normalisation. Teams that do this end up with three separate pipelines, three separate dashboards, and no way to answer the question "what did we spend in total last month?" without a spreadsheet. Normalise to FOCUS first, even if it feels like extra work upfront.
The second pitfall is mapping costs to tags without mapping to business units. Tags are an engineering construct. Finance does not know what env:prod-payments-v2 means. The allocation model must translate tags to the organisational structure that finance and leadership already use. This is a process design problem, not a technical one.
Over-engineering real-time ingestion is the third common waste. Daily refresh is sufficient for the vast majority of finance and FinOps use cases. Near-real-time ingestion is worth the investment only when you are running high-velocity workloads where a cost spike can compound significantly within hours. For most teams, the engineering effort of sub-hourly pipelines is better spent on anomaly detection logic and governance automation.
Three prioritisation rules that actually move the needle: normalise early (FOCUS), map costs to business units not only tags, and validate against invoices before trusting forecasts. In that order. Everything else is optimisation.
Accept daily latency as your baseline. Invest in near-real-time only when you have evidence that daily detection is causing material financial harm, not because it sounds more sophisticated.
Cut the time to value with Koritsu AI
Most teams spend weeks wrangling exports, debating schemas, and building dashboards that finance still does not trust. The real cost is not the engineering hours. It is the delayed visibility into spend that is compounding every day.

Koritsu AI combines the Kori AI agent with hands-on FinOps expertise to compress that timeline. Kori continuously analyses your cloud spend, surfaces where money is being lost, and maps findings directly to the role-based dashboard structure described in this guide. The specialists handle the export enablement, FOCUS normalisation, and reconciliation work so your team can focus on acting on the data rather than producing it.
The model is outcome-based: start with a free cloud cost assessment and pay only from the savings found. For UK teams that want to see what this looks like in practice, the UK bidding platform case study shows a 52% cost reduction delivered through exactly this approach.
Useful sources
The following authoritative references cover each phase of the implementation pipeline:
- AWS Cost and Usage Report documentation: start here for CUR setup, field definitions, and export configuration (ingest phase).
- GCP billing export to BigQuery: primary reference for enabling detailed and pricing exports and running SQL analysis against billing lines (ingest and normalise phases).
- Azure Cost Management exports schema index: field-level documentation for all Azure export types (ingest and normalise phases).
- Azure Cost Management improved exports tutorial: step-by-step guide for configuring daily granular exports to Azure Storage (ingest phase).
- Azure Storage account overview: reference for the storage layer that receives Azure billing exports (ingest phase).
- FOCUS specification: the canonical schema definition for multi-cloud cost and usage normalisation (normalise phase).
- A2A FinOps platform on AWS: detailed case study on FOCUS adoption, organisational mapping, and unified dashboard delivery (normalise and visualise phases).
- AWS customised billing dashboards: guidance on provider-native dashboard widgets and sharing across accounts (visualise phase).