FinOps Inform · Cost Allocation
Cloud cost per feature: a guide for engineering teams
Discover what cloud cost per feature really means and how to accurately track spending. Make informed decisions on feature value today!

Most engineering managers assume their cloud bill maps cleanly to services or environments. It does not. Understanding what cloud cost per feature really is requires you to look past the invoice line items and reconstruct how compute, networking, storage, and observability costs accumulate around individual product capabilities. That distinction matters enormously. When you cannot attribute spend to a specific feature, you cannot make informed decisions about whether that feature is worth running, scaling, or retiring. This guide explains how cost allocation at feature level works, what makes it difficult, and how to set it up in practice.
Key takeaways
| Point | Details |
|---|---|
| Cloud costs extend beyond compute | Network egress, telemetry, and storage often contribute more to per-feature costs than raw compute. |
| Tagging alone is insufficient | Combining AWS Cost Allocation Tags with Cost Categories produces more defensible and complete attribution. |
| Shared infrastructure complicates attribution | Statistical allocation keys are necessary when direct tagging of shared resources is not feasible. |
| Reconciliation prevents misallocation | Per-feature cost totals must reconcile back to provider invoices to remain operationally credible. |
| Feature economics drive real decisions | Per-feature cost data supports investment, deprecation, and pricing decisions when tied to revenue or usage. |
What makes up cloud cost per feature
The cloud cost per feature is the total infrastructure spend attributable to a single product feature over a given period. That sounds straightforward until you start listing what that actually includes.
Cloud costs per feature must account for compute, storage, networking, and observability as major cost drivers. Each of these categories behaves differently across features, and ignoring any one of them produces a distorted picture.
Here is how each category typically maps to feature-level spend:
- Compute: The most visible cost. EC2 instances, Lambda invocations, container task hours, and serverless execution all fall here. A feature that triggers frequent background processing will accumulate compute costs quickly, even if its user-facing footprint looks small.
- Storage: Object storage reads and writes, database queries, and cache usage. Features that generate or retrieve large volumes of data carry a storage cost that is easy to overlook in aggregate billing.
- Networking: Data egress charges are one of the most underestimated cost drivers. A feature that calls external APIs, streams media, or transfers data across availability zones can generate significant egress fees that never appear in compute metrics.
- Observability: Log ingestion, distributed tracing, and metrics storage are not free. Features with verbose logging or high request volumes can generate telemetry costs that rival their compute spend.
- Third-party services: Managed services, SaaS integrations, and licensed components attached to a feature add costs that must be attributed alongside infrastructure.
The table below illustrates how these categories might distribute across two contrasting features in a typical SaaS product:
| Cost category | Search feature (high compute) | Export feature (high egress) |
|---|---|---|
| Compute | 60% | 15% |
| Storage | 10% | 20% |
| Networking (egress) | 5% | 50% |
| Observability | 20% | 10% |
| Third-party | 5% | 5% |
The common pitfall is treating the compute line as a proxy for total feature cost. For the export feature above, that approach would misrepresent the actual cost by a factor of more than three.

Technical methods for allocating costs to features
Once you understand what goes into a feature's cost, the next challenge is attribution. How do you actually get your cloud provider's billing data to reflect feature-level spend?
In AWS, the two primary mechanisms are Cost Allocation Tags and Cost Categories. Used together, they provide more defensible cost allocation than tagging alone.
Here is a practical sequence for setting this up:
- Define your tagging taxonomy. Agree on a standard set of tag keys across your engineering teams. Common keys include
feature,team,environment, andproduct. Consistency matters more than granularity at this stage. - Apply tags at the resource level. Tag EC2 instances, RDS clusters, Lambda functions, S3 buckets, and any other resources that are directly owned by a feature. Use infrastructure-as-code to enforce this at provisioning time.
- Activate tag keys in AWS Billing. Tagging resources is not enough on its own. You must activate tag keys in the Billing and Cost Management console before those tags appear as dimensions in Cost Explorer and cost reports.
- Configure Cost Categories. Use Cost Categories to group tagged resources into logical feature buckets. This is where you handle resources that serve multiple features, using split charge rules to distribute shared costs.
- Define split charge rules. For shared infrastructure, AWS Cost Categories support three allocation methods: even-split (divide equally across all targets), fixed-percentage (assign predetermined proportions), and proportional cost-based splits (distribute in proportion to each target's direct costs).
- Reconcile regularly. Run monthly checks to confirm that the sum of your per-feature cost attributions matches the total on your provider invoice. Gaps indicate untagged resources or misconfigured categories.
For organisations using AWS Organisations, account-level tags automatically apply to all metered usage within tagged accounts, which significantly reduces the configuration burden when features map to dedicated accounts.
Pro Tip: Do not wait until your tagging taxonomy is perfect before activating Cost Categories. Start with your highest-spend features, get attribution working for those, and expand incrementally. Waiting for a complete taxonomy means waiting indefinitely.
Challenges in per-feature cost accuracy
Getting to accurate per-feature costs in the real world is harder than the tooling documentation suggests. Three problems come up repeatedly.
The first is shared infrastructure. Databases, message queues, API gateways, and observability platforms are rarely owned by a single feature. When ten features share one RDS instance, you cannot tag that instance to one feature without misrepresenting the other nine. Statistical allocation becomes necessary here. You choose an allocation key, such as request count, CPU time, data egress, or query volume, and distribute the shared resource's cost in proportion to each feature's measured usage of that key.
The choice of allocation key matters. Request count is easy to measure but does not reflect cost accurately if some features make expensive queries and others make cheap ones. CPU time is more accurate but harder to collect at feature granularity without instrumentation changes. There is no universally correct answer. As one framework for IT unit economics notes, cost-per-feature metrics may ultimately be policy-based decisions rather than pure measurements.
The second problem is incomplete attribution. If 30% of your cloud spend sits in untagged resources, your per-feature costs are systematically understated. This does not just affect the numbers. It affects the decisions those numbers inform. A feature that looks profitable may not be once you account for its share of the untagged infrastructure it depends on.
The third problem is reconciliation. A unit-economics model that sums per-request costs tagged to each feature must ultimately reconcile back to the provider invoice. If your per-feature totals do not add up to what you actually paid, something is wrong in your attribution model, and you need to find it before you act on the data.
"Per-feature cloud cost accuracy is often a trade-off between measurement granularity and operational overhead. Policy decisions on allocation methods complement technical attribution."
— IT Unit Economics
Used well, feature-level economics support three types of decision. They tell you which features justify further investment. They surface candidates for deprecation. And they give product and pricing teams real data on the infrastructure cost of what they are selling.
How to implement feature-level cost analysis
Setting up per-feature cost analysis is as much an organisational challenge as a technical one. Here is a practical approach that accounts for both dimensions.
- Start with a cost inventory. Before you tag anything, map your existing cloud resources to features as best you can. Identify which resources are clearly owned by a single feature, which are shared, and which are genuinely unattributable. This gives you a realistic picture of the work ahead.
- Align tagging strategy with product structure. Your tag keys should reflect how your product team thinks about features, not how your infrastructure team organises resources. If the product team calls something "advanced search," that is the tag value, not "elasticsearch-cluster-prod-3."
- Integrate cost data into engineering workflows. Cost data that lives only in a finance dashboard does not change engineering behaviour. Feed per-feature cost metrics into your sprint reviews, your architecture decision records, and your post-incident reviews. Make cost a first-class engineering metric.
- Automate anomaly detection. Manual cost reviews catch problems too late. Set up automated alerts for per-feature cost spikes. A feature that suddenly costs three times its baseline is either experiencing unexpected load or has a resource leak. Either way, you want to know within hours, not at month-end. Our article on surprise bills from anomalies covers this in detail.
- Build cross-functional ownership. FinOps, engineering, and product teams each have a role. FinOps owns the allocation model and reconciliation process. Engineering owns tagging compliance and instrumentation. Product owns the decisions that the cost data informs. Without all three, the process breaks down. Per-feature cost accuracy depends on both technical tooling and collaborative processes across finance and product teams.
Pro Tip: Treat your tagging compliance rate as a KPI. Track the percentage of monthly spend that is tagged and attributed to a feature. Aim for 80% or above before drawing conclusions from your per-feature data. Below that threshold, the gaps are large enough to invalidate your analysis.
Comparing cloud cost allocation models
Not all allocation approaches suit every architecture. The table below compares the three most common models against the criteria that matter most for per-feature analysis.
| Allocation model | Accuracy | Complexity | Suitable for |
|---|---|---|---|
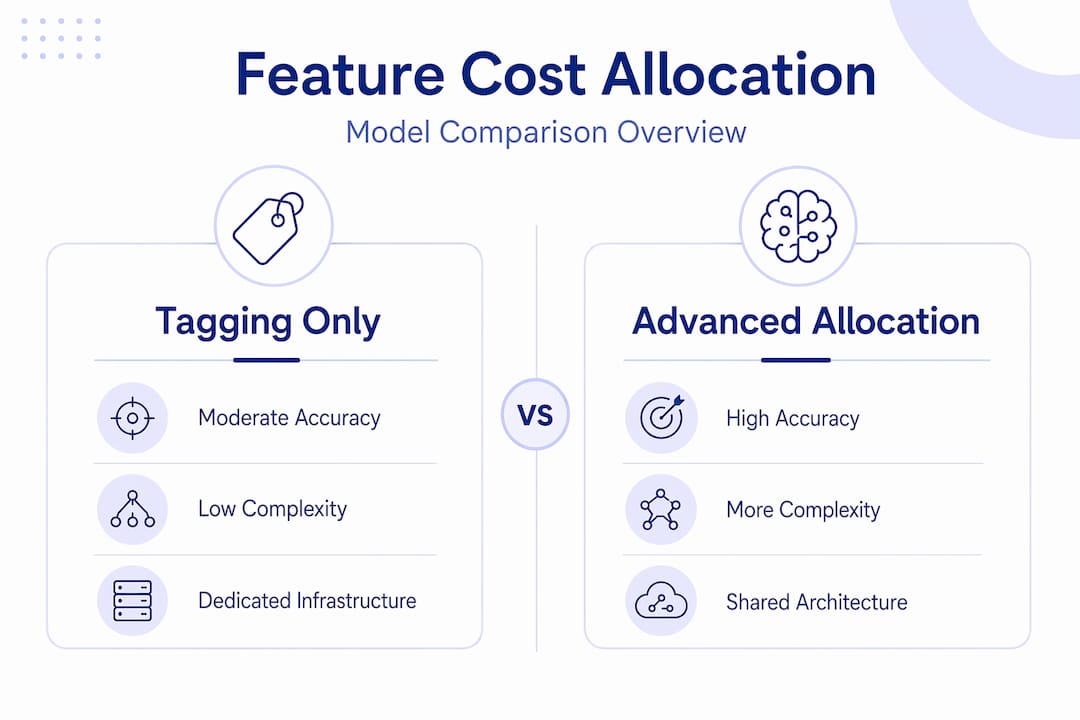
| Tagging only | Moderate | Low | Architectures with clear resource ownership per feature |
| Cost Categories with split rules | High | Medium | Mixed architectures with some shared infrastructure |
| Statistical allocation (usage-based keys) | Highest | High | Microservices or shared-platform architectures |
Tagging only works well when your features map cleanly to dedicated infrastructure. If your search feature runs on its own cluster and your export feature runs on another, direct tagging gives you accurate attribution with minimal overhead. The moment you introduce shared databases, API gateways, or observability platforms, tagging alone leaves gaps.
Cost Categories with split rules fill those gaps by letting you define how shared costs distribute across features. The trade-off is configuration overhead and the need to revisit split rules when your architecture changes. Combining tagging with Cost Categories improves coverage and makes your allocation model more defensible when presenting costs to finance or leadership.
Statistical allocation is the most accurate approach for complex, shared architectures, but it requires instrumentation to collect the usage signals that drive the allocation keys. That instrumentation work is real. You should weigh it against the value of the accuracy you gain. For most teams, a hybrid approach works best: direct tagging where possible, Cost Categories for known shared resources, and statistical allocation reserved for the highest-spend shared services.
My honest take on per-feature cost allocation
I have seen a lot of teams invest heavily in tagging strategies and come away disappointed. They tag everything, activate Cost Categories, and then find that the resulting per-feature numbers do not match anyone's intuition about where the money is going. The instinct is to blame the tooling. The actual problem is almost always the process.
In my experience, the teams that get real value from per-feature cost analysis are the ones that treat it as an ongoing discipline, not a one-time project. They review allocation models quarterly. They hold engineers accountable for tagging compliance. They connect cost data to product decisions in a way that actually changes what gets built.
The uncomfortable truth is that perfect attribution is not achievable in most architectures. Shared infrastructure, third-party services, and cross-cutting concerns will always leave some costs in a grey area. The goal is not perfection. It is enough accuracy to make better decisions than you would make without the data.
I have also seen teams get misled by per-feature costs that looked accurate but were not reconciled back to invoices. They made deprecation decisions based on numbers that were 40% understated because a significant chunk of shared infrastructure spend was sitting unattributed. Reconciliation is not optional. It is the check that keeps your model honest.
The cost of cloud features is not a technology problem. It is a process problem. The tools exist. What most organisations lack is the discipline to use them consistently and the cross-functional alignment to act on what they find.
How Koritsu helps you get to real per-feature costs
Getting per-feature cost attribution right requires both the right tooling and the right expertise. Koritsu combines an AI platform that continuously analyses your cloud spending with hands-on specialists who help your engineering teams act on what they find. Kori, our AI FinOps analyst, surfaces misallocated spend, untagged resources, and cost anomalies before they compound. One UK bidding platform achieved a 52% reduction in cloud costs after working with Koritsu to identify inefficiencies buried in how their infrastructure was built and attributed.
Koritsu works on a performance basis. You start with a Savings Opportunity report, and Koritsu takes a share of the savings actually found. If you are ready to understand what your features genuinely cost and act on that data, get in touch.
Start with a Savings Opportunity reportFAQ
What is cloud cost per feature?
Cloud cost per feature is the total infrastructure spend attributable to a single product feature over a defined period, including compute, storage, networking, observability, and third-party service costs. It is calculated by summing all costs from resources tagged or allocated to that feature.
Why is tagging alone not enough for per-feature cost allocation?
Tagging only covers resources with clear single-feature ownership. Shared infrastructure such as databases and API gateways requires split charge rules via Cost Categories or statistical allocation to distribute costs accurately across features.
How do you choose an allocation key for shared resources?
The allocation key should reflect the cost driver most closely. Request count, CPU time, data egress, and query volume are common options. The right choice depends on which metric most accurately represents each feature's proportional use of the shared resource.
How often should per-feature cost models be reconciled?
Monthly reconciliation against provider invoices is the minimum. Gaps between attributed feature costs and actual invoices indicate untagged resources or misconfigured categories that will distort any decisions made from the data.
What decisions does per-feature cost data support?
Feature-level cost analysis supports investment prioritisation, deprecation decisions, and product pricing by providing visibility into the infrastructure cost and return on investment of individual product capabilities.