FinOps Inform
Engineers: Stop Weekend Cloud Cost Spikes Within 4 Hours, Evidence First
Practical, evidence first playbook for engineers to confirm, contain, and prevent weekend cloud cost spikes fast. Reversible actions and Koritsu's success fee.

When a weekend cloud cost spike hits, confirm it in the provider billing console at hourly or daily granularity, route a programmatic alert to the workload owner and on-call, and apply rapid containment to tagged non-production resources while you investigate. From there, scope the incident from account down to owner. Every hour spent guessing costs money and evidence.
TL;DR:
- Most weekend cost spikes result from scheduled jobs, autoscaling misconfigurations, or long-running resources left unchecked due to reduced oversight.
- Accurate investigation requires filtering billing data by account, region, and usage type, while considering data delays of 24 to 36 hours in anomaly detection.
- Reversible containment actions, such as pausing tagged non-production resources and revoking suspect credentials, are critical for quick mitigation within the first few hours.
- Preventive controls like mandatory tagging, autoscaling ceilings, resource TTLs, and regular cost reviews help reduce recurrence of weekend spikes.
- Automated, weekend-aware anomaly detection and precise baselines from historical data are essential for timely alerts and effective cost management.
How to confirm and scope a weekend spike quickly
The first job is separating a real spike from a billing artefact. Open AWS Cost Explorer if you run on AWS, Azure Cost Analysis if you run on Azure, or the Google Cloud billing console if that's your platform, and switch from monthly to daily, then hourly, granularity. A jump that looks alarming at monthly resolution can turn out to be a single afternoon's spot instance rebalance once you narrow the window.
Before you touch anything, export the raw billing rows and the provider's usage logs. This matters more than it sounds. Once you scale down instances, kill jobs or revoke keys, you lose the state that would tell you exactly what ran, for how long and under whose account. Preserve first, act second.
Pro Tip: Export cost-and-usage data to a spreadsheet or query tool before starting containment, so the evidence survives whatever you do next.
Filter aggressively. A weekend spike buried in a consolidated billing view tells you nothing; the same spike filtered by account or project, then by region, service and cost allocation tag, usually points straight at the source. Work through this sequence:
- Filter by account, project or subscription first to isolate which environment moved.
- Narrow by region and service to see whether one component or a whole platform is affected.
- Group by usage type (compute hours, storage, data transfer, API calls) to identify the resource category driving cost.
- Cross-reference against cost allocation tags to find the owning team.
- Compare against the same weekend four weeks prior, not just the previous weekday, since weekend baselines differ from weekday ones.
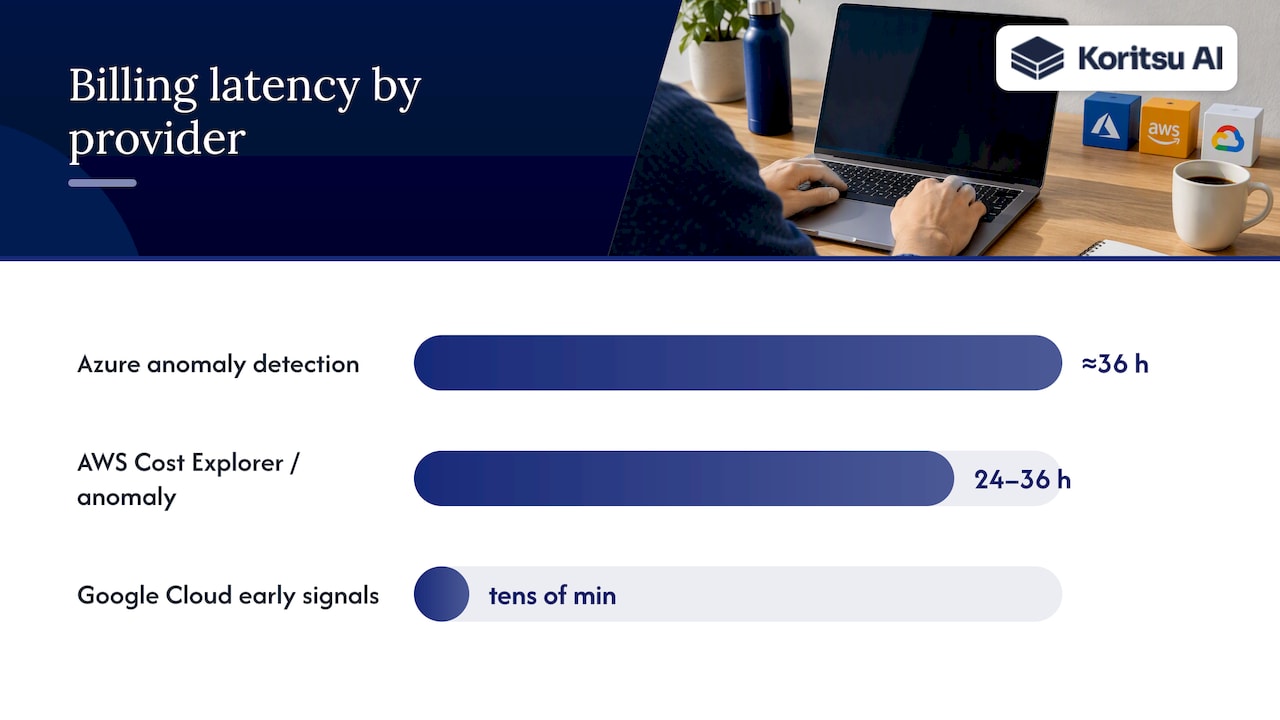
Timing your investigation matters because billing data isn't instant. Anomaly detection can lag behind actual usage by 24 to 36 hours, since Azure's anomaly detection runs roughly 36 hours after the UTC day ends, and AWS Cost Explorer and anomaly detection carry similar data delays. If you're investigating on Saturday morning, the billing console may not yet reflect Friday night's activity in full. Google Cloud is a partial exception: it offers near-real-time early anomaly signals for some AI workloads, with latency on the order of tens of minutes, through its forecasted costs and billing reports tooling.
That lag is the single most overlooked variable in weekend investigations. Engineers assume the billing console is live and build a false timeline around it, then chase the wrong deployment or the wrong on-call shift. Build your incident timeline from usage logs and scheduler records, and treat the billing console as confirmation rather than ground truth. Once you've localised the spike to an account, service and owner, you're ready to diagnose the cause rather than just its size.
Common root causes of weekend cost spikes (how to recognise each)
Most weekend spikes fall into a small number of patterns, and each leaves a distinct signature in your logs. Working through them in order saves time, because the first two account for the majority of incidents engineering teams report.
- Scheduled jobs and cron tasks left enabled for non-production. A batch job, data pipeline or test suite that runs fine on a weekday can quietly multiply cost on a weekend when nobody's watching for a stuck loop or a retry storm. Check scheduler logs and job ownership records first: if a job's last successful run was Friday evening and it's still executing Sunday, you've likely found your cause.
- Rogue or long-running compute, including autoscaling misconfiguration. GPU instances left running after a training job finishes, or an autoscaling group that scales up on a load spike and never scales back down, are classic weekend culprits because nobody's there to notice the graph climbing. Inspect instance start and stop timestamps against expected shutdown schedules, and check for spot interruption handling that failed to release capacity cleanly.
- Storage and data transfer events. A snapshot job that duplicates instead of incrementing, a backup policy that fires more often than intended, or a large export triggered by an automated report can drive up storage and egress costs fast. Snapshot schedules and data transfer dashboards will usually show a clear volume jump at the exact hour the spike began.
- Pricing, mix and allocation shifts. Sometimes nothing actually changed in consumption terms: a reservation or savings plan expired, a workload moved to a new region with different rates, or a new SKU got provisioned without the usual discount coverage. AWS Cost Explorer's underlying model is built around separating volume changes from price and allocation changes precisely because these look identical on a top-line chart but need completely different fixes. Compare SKU-level usage and discount coverage against the prior period before assuming usage itself increased.
- CI/CD loops and external abuse. A deployment pipeline stuck in a retry loop, or unexpected traffic against a public endpoint (sometimes legitimate, sometimes a sign of leaked credentials or a compromised key), can drive weekend cost in ways that look like normal traffic on a dashboard. Check deployment logs for repeated failed builds and review API access patterns for spikes in request volume from unfamiliar sources.
Each of these has a different fix, which is why guessing wastes time. A rogue scheduled job needs a pause; a pricing shift needs a reservation review; a credential compromise needs revocation, not a scale-down. Match the signature to the cause before you act.
Detection and alerting: tune anomaly detection and route alerts for weekend risk
Weekend spikes get expensive because nobody's watching. The fix is monitoring that watches for you, tuned so it catches real problems without drowning your team in noise.
Start with the native tools: AWS Cost Anomaly Detection, Azure's anomaly alerts, and Google Cloud's anomaly detection all build a baseline from historical spend and flag deviations automatically. Pair each with a budget, since anomaly alerts catch unexpected deviations while budgets catch planned spending that's simply grown too large. The two serve different governance purposes and neither substitutes for the other.
Threshold design decides whether your alerting is useful or ignored. A pure percentage threshold means a small development account can trigger an alert for going from $50 to $200 a day, while a genuinely large jump in a major production account might not cross the same percentage line. Use both:
- Set an absolute dollar threshold that reflects what actually matters to your budget, not an arbitrary round number.
- Set a percentage threshold to catch smaller accounts where proportional change is the real signal.
- Require both conditions, or route them to different urgency levels, so small noisy accounts don't crowd out material incidents.
- Review and adjust thresholds quarterly as your baseline spend shifts.
Pro Tip: If one team's account triggers alerts weekly without a real incident, don't disable the alert, recalibrate its threshold. A muted alert is worse than a noisy one.
Routing matters as much as detection. An alert that lands in an inbox nobody checks on a Saturday is functionally the same as no alert at all. Send notifications programmatically, through SNS for AWS or Pub/Sub for Google Cloud, and wire them into a channel someone actually monitors, whether that's Slack, Teams or a paging system. AWS's user notification tooling for Cost Anomaly Detection supports immediate alerts, daily summaries or weekly digests, so you can balance responsiveness against alert fatigue depending on the account's risk profile.
Route by owner, not by a general finance mailbox. The team that owns the workload needs to see the alert first, with on-call as a backstop, because they're the ones who know whether a spike is an incident or an expected batch run. Email-only alerting fails precisely when it matters most: on a weekend, when nobody's refreshing their inbox.
Immediate mitigation playbook (first 60 to 240 minutes)
Once you've confirmed a spike and identified a likely cause, the next few hours decide how much it costs you. Work through containment in this order, preserving evidence as you go.
- Preserve evidence before you touch anything. Export the relevant billing rows, snapshot the scheduler and deployment logs, and capture instance metadata for anything you're about to change. This step takes minutes and saves hours of reconstruction later.
- Isolate the affected scope. Confirm which account, project or subscription is driving the spike, and resist the urge to act across your whole environment when the problem is contained to one team's sandbox.
- Apply reversible containment to tagged non-production resources first. Scale down or pause anything tagged as dev, test or staging before you consider touching production. If a scheduled job is the cause, pause it rather than deleting its definition.
- Revoke suspect credentials if abuse is suspected. Where the pattern points to a leaked key or compromised access, revoke it immediately and rotate related secrets, logging exactly what was revoked and when.
- Communicate as you go. Inform finance and the resource owner with a clear statement of the dollar impact observed so far, and log every mitigation action and who authorised it. This record matters for the post-incident review and for any success-fee or savings conversation later.
- Plan the revert path before you execute anything destructive. Confirm you can bring a paused job or scaled-down service back cleanly before you pull the trigger, and avoid deletes entirely unless you're certain the resource is unrecoverable and unneeded.
Automation should quarantine or scale down tagged non-production resources rather than delete them outright, because a reversible action costs you a delay while a destructive one can cost you data.
The AWS Cost Anomaly Detection FAQs make a similar point about automated responses: scope them narrowly and keep them reversible, because a false positive that deletes a resource is a far worse outcome than a false positive that briefly pauses one. The instinct in a live cost incident is to move fast and fix everything at once. Resist it. A scoped, reversible action you can verify beats a sweeping one you have to explain afterwards, both to your team and to whoever asks why a legitimate weekend batch job got killed mid-run.
Preventive controls and runbook practices to stop weekend spikes recurring
Detection and containment fix this weekend's problem. Prevention is what stops next weekend's version of it, and it rests on a small number of durable controls rather than more monitoring.
Tagging is the prerequisite for everything else. Without mandatory allocation tags mapping every resource to an owning team, your alerts route to nobody in particular, and your investigation starts from zero every time. Make tagging enforcement part of your deployment pipeline rather than a policy people are meant to remember.
- Enforce mandatory ownership tags at resource creation, rejecting deployments that lack them.
- Set resource TTLs on short-lived dev and test environments so forgotten instances expire automatically rather than running indefinitely.
- Default schedulers to a safe, low-cost state outside business hours unless a workload is explicitly marked as needing weekend uptime.
- Set autoscaling guardrails and hard quotas so a runaway scale-up event has a ceiling.
- Tie cost-impact thresholds to specific runbook actions, so a threshold breach triggers a known response rather than a scramble.
Pro Tip: Give every autoscaling group a maximum instance count that reflects your worst realistic load, not an arbitrarily high number "just in case". The gap between those two numbers is where weekend spikes live.
Operational cadence matters too. A weekly review of cost KPIs by service and owner catches drift before it becomes a spike, and a daily check immediately after any deployment catches the misconfigurations that cause weekend incidents in the first place, since Friday deployments are a common trigger for Saturday surprises. Ownership beats central policing here: a platform team trying to monitor every account centrally will always be slower to notice an anomaly than the team that actually owns the workload and knows what normal looks like for it.
How Koritsu approaches weekend spikes: diagnostics, remediation and success fee model
Most cloud overspend isn't sitting in the obvious places, like a missed discount or an unclaimed reservation. It's buried in how the infrastructure was actually built: the scheduler that never got a weekend-off rule, the autoscaling group without a ceiling, the tagging gap that makes a spike untraceable to its owner.
One approach combines two things. An AI platform continuously analyses cloud spending to surface where money is being lost, including the patterns behind recurring weekend spikes. Specialists then work with engineering teams to act on those findings, because a report that identifies an inefficiency is only useful if someone implements the fix.
- The platform runs continuous analysis rather than a one-off audit, so recurring weekend patterns get caught before they repeat.
- Engineers, not just dashboards, review the findings and help implement the fix.
- The pricing model involves charging only when savings are delivered: clients start with a free assessment, and the fee is a share of savings actually found and verified against the bill.
That last point shapes the whole engagement. There's no upfront cost to find out whether a weekend spike pattern is symptomatic of a wider inefficiency, and no incentive to recommend changes that don't produce a measurable saving on the actual invoice.
How to analyse weekend usage patterns versus weekday baselines
Comparing a weekend to the wrong baseline is a common way to miss or misdiagnose a spike. Weekday usage typically reflects active development, CI/CD runs and higher user traffic, while weekend usage should drop for most business workloads unless something specific keeps it running.
Build your baseline from the same day of the week across several recent weekends rather than comparing Saturday to Friday, since the two days carry fundamentally different expected load.
Segment the comparison by service rather than looking at total spend alone. Compute costs often drop sharply on weekends for internal tools while staying flat for customer-facing production, and blending the two into one number can hide a genuine anomaly in either direction. A batch analytics job that runs identically seven days a week isn't an anomaly just because it looks high against a weekday-only mental model. The goal is a baseline specific enough that a real deviation stands out clearly against it.
Impact of different time zones on interpreting weekend cost spikes
Billing platforms typically report usage in UTC, but your team, your on-call rotation and your intuitive sense of "the weekend" almost certainly operate in a local time zone. That mismatch causes real confusion when you're trying to pin down exactly when a spike started.
A job that kicks off at 11 PM Friday in a US-based team's local time may already show as Saturday in UTC-denominated billing data, making it look like a weekend event when it's really a late-Friday one. Conversely, a spike that appears to start on Sunday afternoon UTC might correspond to Sunday morning for a team on the US West Coast, well within their normal weekend working pattern if they run scheduled maintenance then.
When you build your incident timeline, convert every timestamp to a single consistent zone, ideally UTC, since that's how the provider consoles report it, and note the local time separately for context when you're trying to identify who was on shift or what scheduled job triggered at that hour. Distributed teams and multi-region deployments compound this: a spike that looks like a single Saturday event in UTC might actually span two calendar days across the regions your infrastructure runs in.
How to use cost forecasting and budgeting tools for weekend usage trends
Forecasting tools are built to project future spend from historical patterns, and weekend behaviour is exactly the kind of periodicity they need enough history to learn. Google Cloud's billing forecast documentation notes that its models adjust for seasonality and multiple layers of periodicity, including weekly patterns, but need roughly 90 days of historical data to produce reliable longer-term forecasts.
That threshold matters practically: if you've only recently split billing by project or introduced new tagging, your forecast for that segment won't be reliable yet, and a forecast miss shouldn't be mistaken for an anomaly. Set your budget alerts with that limitation in mind, and treat a forecast built on fewer than three months of consistent data as directional rather than precise.
Budgets and forecasts serve a different purpose from anomaly detection. A budget tells you when planned or gradually growing spend is approaching a limit you've set, useful for the slow creep of a scaling workload; an anomaly alert catches the sudden jump that a forecast, by design, smooths over. Run both, and specifically build a weekend-aware budget view if your organisation's weekend and weekday costs genuinely differ, rather than a single monthly figure that blends the two and hides which days are actually driving spend.
Real examples of weekend cost spikes and how teams resolve them
The pattern that recurs most often across engineering teams' post-incident reviews is the same one: a scheduled job or autoscaling policy configured for weekday behaviour that nobody adjusted for the weekend. A batch pipeline set to retry on failure without a cap can run continuously through a quiet Saturday until someone notices the bill on Monday, and the fix is rarely complicated once found: a retry limit, a scheduler pause, a tag that routes the alert to the right owner sooner.
Another common resolution path involves storage and snapshot automation. A backup policy that duplicates a snapshot instead of taking an incremental one can silently multiply storage costs over a weekend when nobody's reviewing the storage dashboard, and teams typically catch it only once cost allocation tagging lets them trace the spike to the specific backup job rather than a vague storage total.

The consistent thread across these resolutions is that the fix is almost never a one-off manual intervention. Teams that stop the recurrence pair the immediate mitigation with a permanent guardrail, whether that's a TTL, a scheduler default or a hard autoscaling ceiling, so the same root cause can't produce the same spike again next weekend.
Author perspective: balancing cost control and engineering velocity
The instinct after a bad weekend spike is to lock everything down: approval gates on every deployment, central policing of every account, alerts for every dollar of variance. That instinct is usually wrong. Automated shutdowns and scaledowns should be reversible and tested in a staging environment before you ever point them at production, because a control designed in a panic tends to break the thing it was meant to protect.
Ownership beats policing. A central team watching every dashboard will always be slower to notice a problem than the team that built the workload and knows its normal shape. The job of governance is to make sure ownership is clear and alerts reach the right person, not to centralise every decision.
I'd also push back on treating a weekend spike purely as a failure. It's a signal, and often a useful one: it shows you exactly where your tagging, your scheduler defaults or your autoscaling bounds weren't tight enough. Treat it as a design review with a dollar figure attached, fix the specific gap it revealed, and move on.
How Koritsu can help: offer and next steps
If weekend spikes keep recurring in your environment, the pattern is usually structural rather than a one-off mistake and finding it manually across every account, service and tag takes engineering time most teams don't have spare. Koritsu's free assessment produces a Savings Opportunity Report that identifies concrete, bill-verified savings, including the kind of scheduler and autoscaling gaps that drive recurring weekend cost.

There's no upfront cost to find out what's there. Koritsu works on a success-fee model: no charge until real savings are identified and verified against your actual bill, at which point Koritsu takes a share of what it finds.
- Start with a free assessment and receive a Savings Opportunity Report scoped to your infrastructure.
- Pay nothing upfront: the success fee is a share of savings verified against your bill.
- Move to ongoing support through the FinOps as a Service plans, Monitor, Advisor, Embedded or Premium, once the initial findings are addressed.
If you'd rather see how the assessment works before committing to anything, the pricing page lays out how the success fee is calculated.
Sources
The provider documentation behind this playbook is worth bookmarking directly rather than relying on secondhand summaries, since anomaly detection behaviour and thresholds change as providers update their tooling.
- AWS Cost Explorer
- Microsoft Learn — analyse unexpected charges
- Google Cloud — forecasted costs and billing reports
FAQ
How can I reduce my cloud costs?
Start by fixing the structural issues that cause spikes and waste, such as untagged resources, oversized instances and schedulers left running outside business hours, rather than only chasing discounts. Rightsizing compute, setting autoscaling ceilings and enforcing resource TTLs typically deliver more sustained savings than a one-off reservation purchase.
What are the disadvantages of cloud storage?
Cloud storage costs can be unpredictable without proper monitoring, since usage-based billing means a misconfigured backup or export job can drive costs up quickly and quietly. It also introduces dependency on the provider's availability and pricing changes, and can create data transfer charges that are easy to overlook until a large export or migration triggers them.
How much does cloud storage cost per GB?
Cloud storage pricing varies significantly by provider, storage class and region, and no single per-gigabyte figure applies across AWS, Azure and Google Cloud. Check your provider's current published pricing page for the specific storage tier and region you're using, since rates also depend on access frequency and retrieval speed.
What will cloud computing look like in 2030?
Longer-term predictions are inherently uncertain, but the operational challenges covered here, cost visibility, ownership and anomaly detection, are likely to remain central regardless of how the underlying technology evolves. Providers are already investing in faster anomaly signals and forecasting, suggesting the trend is toward tighter, more automated cost governance rather than looser oversight.
Why do cloud costs spike specifically on weekends?
Weekend spikes typically happen because the usual human oversight drops off: nobody's watching dashboards, and a scheduled job, autoscaling event or leftover test resource can run unchecked for two days before anyone notices. The fix is usually a combination of tighter scheduler defaults, autoscaling guardrails and alerts that route to an owner rather than a general inbox.