FinOps Inform · Observability
Cloud observability explained for cloud engineers
Discover cloud observability explained for engineers. Learn how it enhances system insights, improves recovery times, and supports cloud strategies.

Cloud observability is defined as the capability to understand a system's internal state by analysing external telemetry signals, specifically logs, metrics, traces, and continuous profiles. It is the standard approach for diagnosing failures in cloud-native and distributed systems where traditional monitoring falls short. Organisations that adopt observability alongside monitoring report at least a 25% improvement in Mean Time to Recovery. That figure alone justifies the shift. Frameworks like OpenTelemetry and practices such as Service Level Objectives (SLOs) have made cloud observability explained not just a concept for academics, but a practical discipline for every engineering team running workloads on AWS, Google Cloud, or Azure.
How does cloud observability differ from traditional monitoring?
Monitoring is deterministic. It detects known failure modes by firing alerts when a metric crosses a predefined threshold. A CPU usage alert at 90%, a memory warning at 85%: these are useful, but they only tell you what you already expected might go wrong.
Observability handles a different problem entirely. Observability allows asking new questions and investigating failure modes that were never anticipated during system design. When a microservice degrades in a way nobody modelled, monitoring stays silent. Observability gives you the correlated telemetry to trace the fault back to its origin.
The practical difference shows up during incidents. With monitoring alone, your team stares at dashboards, guessing which service caused the cascade. With observability, you correlate a spike in trace latency with a specific database query, cross-reference it against recent deployment logs, and isolate the root cause in minutes rather than hours.
- Monitoring covers known failure modes with threshold-based alerts and static dashboards.
- Observability covers unknown unknowns by correlating logs, metrics, traces, and profiles in real time.
- Monitoring requires you to predict what will break before it breaks.
- Observability lets you investigate anything, even failures you never imagined.
The distinction matters most in distributed systems. A monolithic application has one process to inspect. A cloud-native system running dozens of microservices across multiple availability zones has thousands of potential failure points. Monitoring cannot cover that surface area. Observability is built for it.
Pro Tip: Do not replace your existing monitoring dashboards when you introduce observability. Keep threshold alerts for known failure modes and layer observability tooling on top for investigation. The two approaches are complementary, not competing.
What are the four pillars of cloud observability?
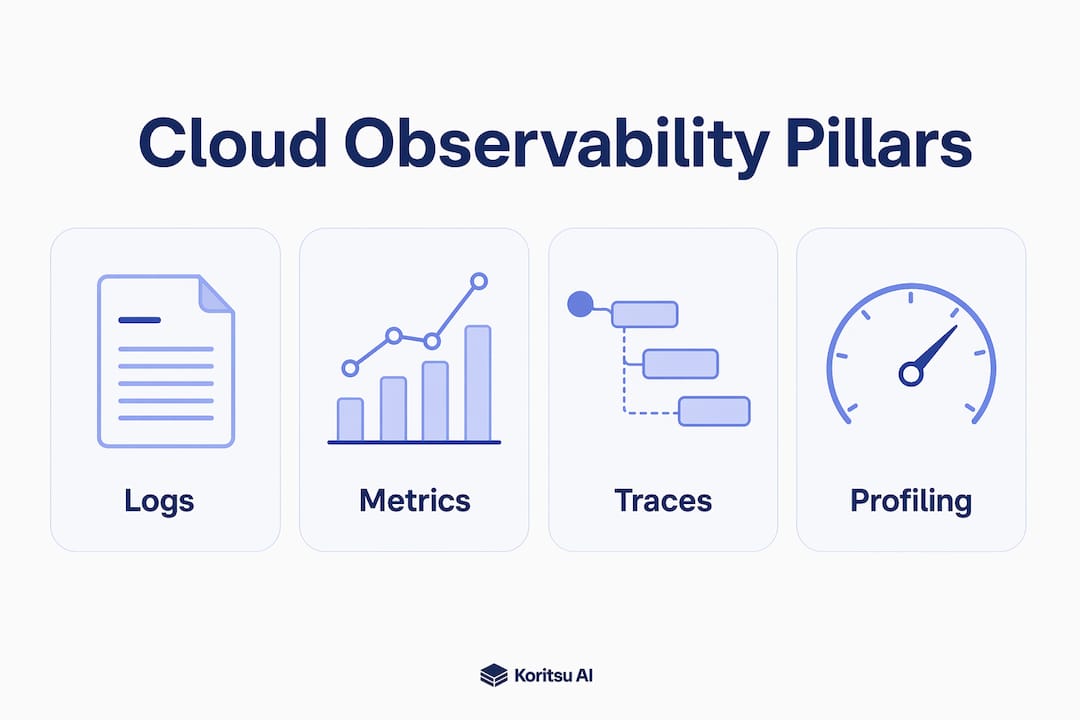
A systematic analysis of 104 research papers confirms four core telemetry signals as the foundation of cloud observability: logs, metrics, traces, and continuous profiles. Each pillar answers a different question about system behaviour.
Logs
Logs are timestamped records of discrete events. A service writes a log entry when a request arrives, when an error occurs, or when a background job completes. Logs are the most granular signal available. They tell you exactly what happened and when, but they are expensive to store at scale and slow to query without structured formatting.
Metrics
Metrics are numerical measurements collected at regular intervals: request rate, error rate, latency percentiles, CPU utilisation. They are cheap to store and fast to query, which makes them ideal for dashboards and alerting. The trade-off is that metrics aggregate data, so they can hide the specific request or user session that caused a problem.

Traces
Distributed tracing shows a request's path through multiple services, breaking down each operation into spans with timing data. A single user request might touch an API gateway, an authentication service, a product catalogue, and a payment processor. Tracing makes that entire journey visible. Without it, latency problems in distributed systems are nearly impossible to attribute to a specific service.
Continuous profiling
Continuous profiling captures real-time performance data at the code level: which functions consume the most CPU, which allocate the most memory. Unlike the other three pillars, profiling operates at the application internals level. It answers the question "why is this service slow?" when metrics show high latency but logs and traces cannot pinpoint the exact function responsible.
| Pillar | Data type | Primary question answered | Storage cost |
|---|---|---|---|
| Logs | Timestamped event records | What happened and when? | High |
| Metrics | Numerical time-series | How is the system performing? | Low |
| Traces | Request journey spans | Where did this request slow down? | Medium |
| Continuous profiling | Code-level performance data | Which function is consuming resources? | Medium |
Proper instrumentation via OpenTelemetry allows engineers to emit all four signal types from a single instrumentation layer. This means you can answer system state questions during an incident without writing new code under pressure.
Pro Tip: Instrument your services for all four pillars from day one, not after your first major incident. Retrofitting observability into a production system under time pressure produces incomplete, inconsistent telemetry that makes incidents harder to resolve, not easier.
What are the key challenges of implementing observability in multi-cloud environments?
Multi-cloud observability is significantly harder than single-cloud observability. The core problem is fragmentation. AWS CloudWatch, Google Cloud Monitoring, and Azure Monitor each use different telemetry formats, different metadata schemas, and different query languages. Stitching those signals together into a coherent picture requires deliberate architectural choices.
Consistent resource tagging enforced via Infrastructure-as-Code is the foundational requirement. Without standardised tags such as environment, service, team, and cost-centre applied uniformly across every cloud resource, telemetry remains siloed. You cannot correlate a latency spike in AWS with a database error in Google Cloud if the resources carry different naming conventions. IaC tools like Terraform and Pulumi enforce tagging at provisioning time, before the resource ever emits a signal.
Trace-context propagation is the second critical requirement. When a request crosses a cloud boundary, the trace context header must travel with it. If any service in the chain drops the header, the distributed trace breaks. OpenTelemetry's W3C Trace Context standard provides a vendor-neutral format that works across cloud providers, but every service in the chain must be instrumented to propagate it correctly.
The architectural choice between centralised and federated telemetry models carries real trade-offs.
| Architecture | Advantages | Disadvantages |
|---|---|---|
| Centralised | Unified dashboards, single query interface, easier correlation | Higher network egress costs, single point of failure |
| Federated | Raw data stays local, lower egress costs, provider resilience | Harder to correlate across clouds, more complex tooling |
Centralised architectures provide unified dashboards but increase network egress costs and introduce a single point of failure. Federated models keep raw data local and reduce egress, but make cross-cloud correlation significantly harder. Most engineering teams at scale adopt a hybrid approach: aggregate pre-processed signals centrally while keeping raw logs federated.
Observability platforms that correlate telemetry against risk context also help security teams map relationships between resources, identities, and vulnerabilities. This extends the value of your telemetry investment beyond incident response into security posture management.
How can observability align monitoring with business objectives?
Raw metric thresholds are a poor proxy for business impact. A CPU alert at 90% might fire during a batch job that affects no users. Meanwhile, a p99 latency degradation that makes checkout 3 seconds slower for real customers might never trigger a threshold alert at all. The disconnect between technical metrics and user experience is where most alert fatigue originates.
SLO-driven alerting resolves this by triggering alerts based on SLO burn rates rather than raw metric thresholds. An SLO burn rate alert fires when your error budget is being consumed faster than sustainable. That directly represents user-facing impact. Your team gets paged when users are actually affected, not when a background process spikes a metric.
Aligning observability with business and engineering objectives also changes how you prioritise engineering work. When your telemetry is linked to SLOs, you can see which services are consuming the most error budget and direct reliability investment there first.
Common pitfalls to avoid when building SLO-driven observability:
- Setting SLOs without baseline data. Measure your current performance for at least four weeks before committing to targets.
- Alerting on too many SLOs simultaneously. Start with two or three user-facing journeys and expand from there.
- Ignoring burn rate windows. A 1-hour burn rate alert catches fast-moving incidents. A 6-hour burn rate alert catches slow degradations. You need both.
- Treating SLOs as static. Review and adjust targets quarterly as your system and user expectations evolve.
Observability data also feeds directly into cloud cost culture decisions. When you can see which services consume the most resources relative to the traffic they serve, you have the evidence to justify rightsizing, architectural changes, or infrastructure consolidation. Observability is not just an operational tool. It is a financial one.
Key takeaways
Cloud observability is the most effective approach to diagnosing unknown failures in distributed cloud systems, requiring logs, metrics, traces, and continuous profiling to deliver complete situational awareness.
| Point | Details |
|---|---|
| Observability vs monitoring | Observability investigates unknown failures; monitoring only detects anticipated ones. |
| Four telemetry pillars | Logs, metrics, traces, and continuous profiles each answer a distinct question about system state. |
| Multi-cloud tagging | Enforce consistent resource tags via IaC to prevent telemetry fragmentation across cloud providers. |
| SLO-driven alerting | Alert on burn rates rather than raw thresholds to reduce fatigue and focus on real user impact. |
| Instrumentation first | Instrument all four signal types from day one using OpenTelemetry to avoid retrofitting under pressure. |
Observability is not a dashboard problem
I have worked with engineering teams that spent months building beautiful dashboards and still could not answer basic questions during a P1 incident. The dashboards were not the problem. The instrumentation was.
The uncomfortable truth about cloud observability is that most teams treat it as a tooling decision when it is actually a design decision. You cannot bolt observability onto a system that was not built to emit meaningful signals. If your services do not emit structured logs, if your traces do not propagate context across service boundaries, if your metrics do not carry consistent labels, no platform will save you.
The second thing I have seen teams consistently miss is the connection between telemetry and business risk. Engineers instrument what is technically interesting. Product managers care about what affects users. The gap between those two perspectives is where incidents drag on for hours. When your traces are linked to specific user journeys and your SLOs map to revenue-critical flows, that gap closes. Your on-call engineer knows immediately whether a degradation matters or not.
Observability is also growing beyond incident response. The same telemetry that helps you debug a production failure also tells you which services are over-provisioned, which code paths are inefficient, and where your cloud spend is going. That is a significant shift. It means observability data is now relevant to engineering managers, finance teams, and CTOs, not just the engineers holding the pager. Teams that recognise this early get far more organisational buy-in for instrumentation investment.
— Kori
How Koritsu AI connects observability to cloud cost reduction
Observability tells you what your system is doing. Koritsu AI tells you what that behaviour is costing you.

Most engineering teams running on AWS, Google Cloud, or Azure have observability data that points directly at inefficiency: over-provisioned services, idle resources, and architectural patterns that burn budget without delivering performance. The problem is translating that telemetry into financial decisions. Koritsu AI's platform continuously analyses your cloud spending and surfaces exactly where money is being lost, combining AI-driven analysis with hands-on specialist advice. One UK bidding platform achieved a 52% reduction in cloud costs after working with Koritsu AI. You can start with a free cloud assessment and only pay when savings are found.
FAQ
What is cloud observability in simple terms?
Cloud observability is the ability to understand what is happening inside a cloud system by analysing telemetry signals such as logs, metrics, traces, and continuous profiles. It goes beyond monitoring by enabling engineers to investigate failures that were never anticipated in advance.
How does observability improve incident response?
Organisations adopting observability alongside monitoring report at least a 25% improvement in Mean Time to Recovery. Correlated telemetry lets engineers trace a fault to its root cause in minutes rather than hours of dashboard-staring.
What is OpenTelemetry and why does it matter?
OpenTelemetry is a vendor-neutral framework for instrumenting cloud applications to emit logs, metrics, and traces in a standardised format. It allows engineers to collect all four telemetry signal types from a single instrumentation layer without vendor lock-in.
What is an SLO burn rate alert?
An SLO burn rate alert fires when your error budget is being consumed faster than your target rate allows. It is a more reliable signal of real user impact than raw metric threshold alerts, and it significantly reduces alert fatigue for on-call engineers.
Why is resource tagging critical for multi-cloud observability?
Without consistent resource tags enforced via Infrastructure-as-Code, telemetry from different cloud providers remains siloed and cannot be correlated. Standardised tags such as environment, service, and team are the minimum required to build a coherent multi-cloud observability picture.