FinOps Inform · Cost Optimisation
Cloud spend attribution explained for engineering and finance
Discover how cloud spend attribution explained can enhance your billing insights. Learn to map costs to teams and improve financial maturity.

Cloud spend attribution maps every line of your infrastructure bill to the team, product, service, or feature that generated it. If you want to start today, open your billing export (AWS Cost and Usage Report, Azure cost export, or GCP billing export to BigQuery) and run a quick tag coverage check: what percentage of your spend has an owner tag? That single number tells you more about your attribution maturity than any dashboard. The FinOps Foundation considers a high level of allocated spend as the benchmark for a mature organisation. Most UK engineering teams we see are well below that when they first look.
A cloud cost attribution model is the structured method you use to move from raw billing data to owned, explainable cost lines. AWS Cost Allocation Tags, Azure Cost Management, and Google Cloud's billing export labels are the native mechanisms that make it possible. Koritsu AI works with UK engineering and finance teams to build and maintain these pipelines, so the rest of this guide reflects what actually works in production.

Why accurate attribution matters to engineering and finance
Attribution is not a reporting exercise. It is the foundation for every cost decision your organisation makes, from quarterly forecasting to architectural trade-offs.
Without it, finance sees a single cloud invoice and has no way to challenge it. Engineering sees a shared bill and has no incentive to optimise. Both teams end up in the same unproductive meeting every month, arguing about a number nobody fully owns.

The business outcomes that attribution unlocks are concrete:
- Accountability with evidence. Every resource gets an owner. High-performing organisations allocate most cloud usage to a business owner; the FinOps Foundation treats a high allocation rate as the baseline for maturity.
- Forecasts finance can defend. When allocation is clean, finance can tie budgets to real usage patterns rather than adding a contingency buffer to last quarter's invoice.
- Targeted optimisation. With proper attribution, you can pinpoint waste at the team or feature level rather than trawling billing CSVs. Teams with mature allocation move significantly faster on cost-saving actions.
- Product unit economics. Knowing the cost per API call, per transaction, or per active user is only possible once spend is attributed to the feature generating that usage. This feeds directly into pricing decisions and business outcome alignment.
Showback versus chargeback
Showback means surfacing attributed costs to teams as information, without deducting from their budget. Chargeback makes it real: the attributed spend is deducted from a team's budget or forecast. Both require consistent tagging and a trusted allocation model, but they serve different purposes.
Start with showback. It builds awareness without creating billing friction before your data quality is proven. Once teams trust the numbers and ownership is clear, move to chargeback. Introducing chargeback before allocation rules are stable is one of the fastest ways to destroy trust in the whole programme.
What are the main cloud cost attribution models?
There is no single correct model. The right choice depends on your architecture, the granularity of your billing data, and how much engineering effort you can invest. Most mature organisations use a combination.
| Model | Accuracy vs effort | Tooling required | Best for | Data required | Reconciliation complexity |
|---|---|---|---|---|---|
| Direct / tag-based | High accuracy, moderate effort | Billing export, cost allocation tags | Dedicated resources, single-tenant workloads | Resource IDs, tag metadata | Low: direct mapping to GL cost centres |
| Proportional / usage-based | Medium accuracy, higher effort | Usage metrics, billing export joins | Shared infrastructure, multi-tenant services | CPU/memory/request metrics per consumer | Medium: requires usage data joins |
| Activity-based | High accuracy, highest effort | Event telemetry, billing joins | Microservices, per-transaction pricing | Event counts, transaction IDs | High: event-to-billing reconciliation |
| Shared-pool / amortised | Lower accuracy, low effort | Billing export only | Baseline shared services (DNS, logging) | Billing totals, allocation keys | Low: fixed-ratio splits |
| Committed-discount attribution | Medium accuracy, moderate effort | Reservation metadata, billing export | Reserved Instances, Savings Plans, CUDs | Commitment IDs, utilisation data | Medium: on-demand vs effective cost delta |
Worked example: splitting a shared network cost. Suppose your VPC egress bill for the month is £10,000 and three teams consume it. Team A generated 55% of outbound traffic, Team B 30%, and Team C 15%. A proportional model allocates £5,500, £3,000, and £1,500 respectively. A shared-pool model might split it equally at £3,333 each. The proportional approach is more accurate but requires you to join billing data to network flow logs. The shared-pool approach is faster to implement but penalises efficient teams.
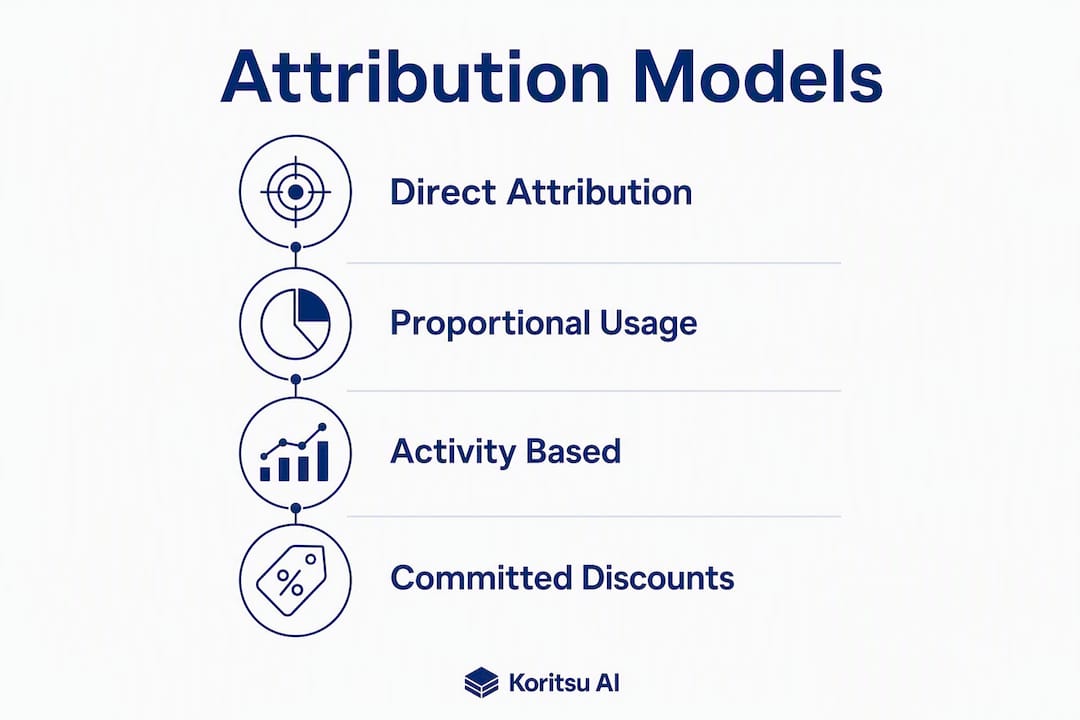
Direct / tag-based is the right starting point for most teams. Tag every resource with an owner, environment, and product label, then let the billing export do the heavy lifting. The limitation is that not every resource emits tags in its usage record, which is why Azure's tag inheritance feature exists.
Proportional / usage-based suits shared infrastructure such as Kubernetes clusters or RDS instances serving multiple products. The accuracy is better than a fixed split, but you need reliable usage metrics per consumer, which means instrumentation work upfront.
Activity-based attribution is the gold standard for microservices architectures, where a single Lambda function or container might serve dozens of features. It requires event telemetry that carries a product or customer token, which you can then join to billing lines.
Committed-discount attribution is frequently overlooked. Reserved Instances, AWS Savings Plans, and Google Cloud Committed Use Discounts (CUDs) reduce your effective cost, but the discount is often pooled at the account or billing account level. Without explicit attribution of that discount to the teams that consumed the committed capacity, some teams appear artificially expensive and others artificially cheap.
Which provider features enable attribution?
Each major cloud provider gives you the raw materials for attribution, but they differ in how complete and consistent those materials are.
AWS
- Cost and Usage Report (CUR): the most granular billing export available, with line-item detail down to the resource ID and hour. Export to S3 and query with Athena or load into a data warehouse.
- Cost Allocation Tags: user-defined and AWS-generated tags that appear in the CUR. You must activate them in the Billing console before they appear in exports. There is a limit of 500 user-defined cost allocation tags per account.
- Cost Explorer: a managed UI and API for querying attributed spend by tag, service, account, or linked account. Useful for quick showback reports but limited for complex multi-dimensional allocation rules.
- Cost Categories: a rules engine that lets you map accounts, tags, and services to named cost categories, which then appear as a dimension in Cost Explorer and the CUR. Useful for building a chargeback model without a custom data pipeline.
- Reservation and Savings Plan metadata: the CUR includes columns for RI and Savings Plan utilisation, amortised cost, and effective cost. These are the columns you need for committed-discount attribution.
A common AWS gap: tags applied after resource creation do not backfill historical CUR records. Tag your resources at provisioning time, ideally via infrastructure-as-code, or you will have gaps in historical attribution.
Azure
- Cost exports: scheduled exports to Azure Blob Storage in CSV format, covering actual and amortised cost. Use the amortised export for reservation attribution.
- Tags and tag inheritance: Azure supports key-value tags on resources, resource groups, and subscriptions. Tag inheritance in Microsoft Cost Management propagates subscription and resource group tags to child resources, which is a significant advantage when not every resource emits tags in its usage record.
- Management groups: logical containers that group subscriptions for policy and cost reporting. Microsoft's FinOps guidance recommends aligning management group hierarchies with your cost allocation strategy.
- Cost allocation rules: a feature in Microsoft Cost Management that lets you split shared subscription costs across other subscriptions, resource groups, or tags. Useful for redistributing central platform costs to consuming teams.
- Billing hierarchy: Enterprise Agreement (EA) and Microsoft Customer Agreement (MCA) accounts have different billing hierarchies (department/enrolment account vs billing profile/invoice section). Your allocation model needs to account for which hierarchy applies.
Google Cloud
- Billing export to BigQuery: GCP's primary mechanism for detailed billing data. Export at the resource or project level; the resource-level export includes labels and SKU details.
- Labels: key-value metadata applied to GCP resources. Labels appear in the BigQuery billing export and are the primary attribution mechanism. Unlike AWS tags, GCP labels do not require separate activation for billing export.
- Projects and folders: GCP's resource hierarchy (organisation, folder, project) maps naturally to teams or environments. Structuring projects by team is often the simplest attribution approach for GCP workloads.
- Google Cloud Cost Attribution Solution: a reference architecture published by Google that uses BigQuery, Looker Studio, and billing export data to build a multi-dimensional attribution pipeline. It handles label propagation, shared cost splitting, and commitment attribution in a single deployable solution.
- Committed Use Discount metadata: the billing export includes CUD fields that let you attribute the effective (post-discount) cost to the project or label that consumed the committed capacity.
A common GCP gap: labels are not retroactively applied to historical billing records. As with AWS, label resources at creation time.
Pro Tip: Before choosing a provider feature, check your tag or label coverage first. A 60% coverage rate means 40% of your spend is unattributed by default. Fix coverage before building complex allocation rules on top of incomplete data.
How do you implement attribution step by step?
Attribution is a pipeline, not a report. The cost attribution engine follows a consistent pattern: ingest billing and telemetry, normalise, map resources to business metadata, apply allocation rules, and persist auditable outputs.
Phase 1: define cost objects and ownership
- Define your cost objects: the teams, products, services, environments, or features you want to attribute spend to. A cloud cost centre is the finance-facing version of this concept.
- Agree on a tagging taxonomy: at minimum,
owner,product,environment, andcost-centre. Document naming conventions and enforce them via AWS Service Control Policies, Azure Policy, or GCP Organisation Policies. The US Federal Cloud Tagging Strategy Guide is a useful reference for naming convention design, even outside government contexts. - Assign an owner to every cost object. Ownership mapping for cloud cost by team should be documented in a CMDB or equivalent register, not just in a spreadsheet.
Phase 2: technical implementation
- Enable billing exports: AWS CUR to S3, Azure cost export to Blob Storage, GCP billing export to BigQuery.
- Ingest and normalise: load exports into a central data warehouse (BigQuery, Snowflake, Redshift, or similar). Normalise schema across providers if you are multi-cloud.
- Enrich with business metadata: join billing lines to your CMDB, HR system, or product catalogue to resolve resource IDs to cost objects. A simple join pattern:
SELECT
  b.resource_id,
  b.cost,
  b.usage_date,
  m.team_name,
  m.product_name,
  m.cost_centre
FROM billing_lines b
LEFT JOIN resource_metadata m
  ON b.resource_id = m.resource_id
WHERE b.usage_date BETWEEN '2026-01-01' AND '2026-01-31'- Apply allocation rules: direct mapping where tags exist; proportional or shared-pool rules for untagged shared resources. Version your allocation rules and store them with the output records for auditability.
- Build showback reports: dashboards by team, product, and environment. Share with engineering leads before moving to chargeback.
Phase 3: roles and rollout
| Role | Responsibility |
|---|---|
| Platform / infrastructure team | Tag enforcement, billing export configuration, pipeline maintenance |
| Engineering leads | Ownership declarations, tagging compliance per service |
| Finance / FinOps | Allocation rule design, reconciliation to GL, chargeback policy |
| Product management | Cost object definitions, unit economics reporting |
Rollout in phases: start with showback (weeks 1 to 4), then introduce chargeback for well-tagged cost centres (months 2 to 3), then automate allocation rules and anomaly alerts (months 3 to 6). Trying to do all three simultaneously is the most common reason attribution programmes stall.
What data problems break attribution in practice?
The engineering work of attribution is mostly a data quality problem. The allocation logic is usually straightforward once the data is clean.
| Issue | Impact | Mitigation |
|---|---|---|
| Billing line granularity too coarse | Cannot distinguish per-resource or per-feature cost | Enable resource-level billing export (AWS CUR resource IDs, GCP resource-level export) |
| Timing mismatches between billing cycle and usage window | Allocated costs don't reconcile to invoice totals | Align attribution windows to billing cycle; carry forward accruals for month-end close |
| Marketplace SKUs and third-party charges | Costs appear without resource IDs or tags | Maintain a marketplace SKU register; map manually or exclude with a documented residual |
| High-cardinality joins (multi-tenant, per-customer) | Join performance degrades; allocation runs slowly | Pre-aggregate usage metrics to a daily grain before joining to billing; partition tables by date |
| Missing customer or product tokens in telemetry | Cannot attribute shared compute to individual tenants | Instrument services to emit a product_id or tenant_id in structured logs; join via observability data |
| Reservation and discount metadata absent | Effective cost differs from on-demand cost; teams see inflated or deflated figures | Use amortised cost columns in billing exports; attribute CUD/RI/SP savings explicitly |
The timing mismatch issue is subtler than it looks. Just as attribution windows in marketing change which events get credited, the window you choose for cloud billing attribution changes which team gets charged for a resource that was provisioned in one month and deleted in the next. Agree on a window convention (calendar month, usage date, or invoice date) and apply it consistently.
Pro Tip: For high-cardinality multi-tenant joins, pre-aggregate your usage telemetry to a daily grain per tenant before joining to billing lines. A row-level join across millions of billing records and billions of telemetry events will time out or cost more in compute than the attribution is worth.
How do you validate attribution and reconcile with the general ledger?
Attribution outputs are only useful if finance trusts them. That trust comes from a repeatable reconciliation process, not from a well-designed dashboard.
A monthly reconciliation should cover:
- Invoice reconciliation: sum your attributed costs across all cost objects and compare to the raw invoice total. The difference is your residual (unallocated spend). Track residual as a percentage of total spend; aim to reduce it each month.
- Discount and commitment reconciliation: compare on-demand cost to effective cost for each team. The delta is the team's share of committed discounts. If you are not attributing this explicitly, some teams will appear to overspend relative to their actual consumption.
- Timing adjustments: identify costs that crossed a billing cycle boundary and apply accruals or reversals consistent with your accounting policy.
- GL mapping: map each cost object to a general ledger account code. Attribution feeds into GL reporting but does not replace it. As ROI measurement frameworks make clear, granular attribution is an input to whole-of-business cost analysis, not a substitute for it.
Key KPIs to track:
- Allocated %: the share of total cloud spend attributed to a named owner. Target 90% or above.
- Cost per transaction / cost per active user: unit cost metrics that connect cloud spend to product output.
- Forecast variance: the difference between attributed spend forecast and actual invoice, measured monthly.
- Residual trend: unallocated spend as a percentage of total, tracked over time.
An audit trail requires that every allocated cost line can be traced back to a raw billing record, an allocation rule version, and the metadata that drove the split. Version your allocation rules and preserve raw billing exports. Provenance is what convinces finance to accept internal chargebacks rather than dispute them.
What governance and pitfalls should you watch for?
Attribution is not a one-off project. Organisations change, architectures evolve, and tagging coverage drifts. Without governance, an attribution model that was 90% accurate in January can be 60% accurate by June.
A governance policy should include:
- Tagging rules: mandatory tags, allowed values, and naming conventions documented and version-controlled.
- Enforcement: AWS Service Control Policies, Azure Policy, or GCP Organisation Policies that block resource creation without required tags.
- Compliance KPIs: tag coverage percentage reported monthly to engineering leads and finance.
- Allocation rule versioning: every change to an allocation rule is logged with a timestamp, author, and rationale. Changes take effect at the start of a billing cycle, not mid-month.
- Ownership register: a maintained list of cost objects and their owners, reviewed quarterly.
- Audit cadence: a monthly reconciliation review (finance and FinOps) and a quarterly ownership review (engineering leads and product management).
Common mistakes that make attribution brittle:
- Over-attribution: assigning 100% of a shared service cost to the largest consumer, ignoring smaller teams. Use proportional splits for shared infrastructure.
- Ignoring reservations and discounts: teams that consume Reserved Instances appear cheaper than they are at on-demand rates; teams that don't consume them appear more expensive. Attribute effective cost, not list cost.
- Not automating drift detection: tag coverage should be monitored continuously, not checked quarterly. An alert when coverage drops below a threshold catches problems before they compound.
- Treating attribution as a finance problem: tagging and metadata are engineering work. Finance cannot fix a missing
ownertag on a Lambda function. Ownership of the pipeline must sit with the platform team, with finance as the consumer.
Running attribution as a continuous operational process
The difference between teams that maintain accurate attribution and those that don't is not the sophistication of their tooling. It is whether attribution is treated as a continuous operational process or a quarterly project.
A practical operating model has three layers:
- Data pipeline: automated ingestion of billing exports on a daily schedule, normalisation, enrichment from CMDB, and allocation rule application. Outputs land in a data warehouse with a retention policy of at least 13 months for year-on-year comparison.
- Feedback loop: a weekly sync between the platform team and engineering leads to review tag coverage, flag new untagged resources, and update the ownership register. Finance joins monthly for reconciliation.
- Automated alerts: drift detection that fires when tag coverage drops below threshold, when a new resource type appears without a tag, or when a cost object's spend changes by more than a defined percentage week-on-week.
A sample runbook cadence:
- Daily: billing export ingestion, tag coverage check, anomaly alert review.
- Weekly: untagged resource report to engineering leads, allocation rule validation, coverage KPI update.
- Monthly: invoice reconciliation, residual analysis, forecast variance review, GL mapping update.
- Quarterly: ownership register review, allocation rule audit, tagging policy update, roadmap for coverage improvements.
A prioritisation matrix for attribution improvements: rank each improvement by impact (reduction in unallocated spend or improvement in forecast accuracy) against implementation effort. Quick wins are high-impact, low-effort items such as enabling tag inheritance on Azure or activating cost allocation tags in the AWS Billing console. Longer-horizon items such as activity-based attribution for microservices require instrumentation work but deliver the most granular cost visibility.
Pro Tip: Treat your allocation rules as code. Store them in version control, review changes in pull requests, and deploy them on a schedule aligned to your billing cycle. An allocation rule change that takes effect mid-month creates reconciliation headaches that are hard to explain to finance.
Key takeaways
Accurate cloud spend attribution requires consistent tagging, a versioned allocation pipeline, and a continuous governance process, not a one-off reporting exercise.
| Point | Details |
|---|---|
| Start with tag coverage | Check what proportion of spend has an owner tag before building allocation rules; aim for a high coverage level. |
| Choose the right model | Direct/tag-based suits dedicated resources; proportional suits shared infra; activity-based suits microservices. |
| Reconcile to the invoice | Sum attributed costs monthly and compare to the raw invoice; track residual as a percentage and reduce it over time. |
| Govern continuously | Version allocation rules, enforce tagging via policy, and audit ownership quarterly to prevent coverage drift. |
| Koritsu AI for attribution | Koritsu AI combines a continuous monitoring platform with hands-on FinOps expertise to build and maintain attribution pipelines for UK engineering and finance teams. |
The trade-offs teams rarely talk about
Most attribution guides focus on the mechanics: which tags to apply, which exports to enable, which tool to use. What they underplay is the organisational friction.
The hardest part of attribution is not the data pipeline. It is getting engineering teams to accept that their cloud bill is now visible, named, and tied to their quarterly planning. Showback is easy to introduce because it carries no immediate financial consequence. Chargeback is where programmes stall, because it requires finance and engineering to agree on what "fair" means when a shared Kubernetes cluster serves six products with very different traffic patterns.
My view: the accuracy-versus-effort trade-off is real, but it is often used as an excuse to avoid the harder conversation about ownership. A proportional model that attributes 85% of spend accurately and is trusted by all teams is worth more than a theoretically perfect activity-based model that nobody believes. Start with what you can defend in a monthly review, then improve incrementally.
The other thing teams underestimate is committed-discount attribution. Reserved Instances and Savings Plans are often managed centrally, and the savings are invisible to the teams that drove the commitment decision. Surfacing that delta, what a team would have paid at on-demand rates versus what they actually paid, changes the conversation from "why is our cloud bill so high?" to "here is the return on our commitment planning." That shift in framing is where attribution starts to feel like a business tool rather than a cost-control exercise.
How Koritsu AI can help you get attribution right
Most UK engineering teams we work with have the raw materials for attribution already in place: billing exports are enabled, some tags exist, and someone in finance is asking for a cost breakdown by team. What's missing is the pipeline to connect them, the governance to keep them accurate, and the expertise to reconcile the outputs to the general ledger.

Koritsu AI combines a continuously running analytics platform with hands-on FinOps expertise. Kori, our AI agent, surfaces attribution gaps, untagged resources, and allocation drift in real time. Our specialists help engineering and finance teams build the allocation rules, reconciliation processes, and governance policies that make attribution stick. Engagements start with a free assessment: we map your current tagging coverage, identify the highest-impact attribution gaps, and give you a clear picture of where your cloud spend is going before you commit to anything. From there, we work on a success-fee basis, taking a share of the savings we actually find. If you want attribution that is auditable, trusted by finance, and maintained as your architecture evolves, start with a free assessment at Koritsu AI.
Useful sources and further reading
- FinOps Foundation: Cloud Cost Allocation, the canonical community framework for allocation maturity, showback, and chargeback models.
- Microsoft Cost Management: cost allocation introduction, Azure's official documentation covering management groups, tags, tag inheritance, and cost allocation rules.
- Microsoft Cloud Adoption Framework: FinOps allocation guidance, practical guidance on defining allocation strategy, enforcing tagging policies, and using Cost Management allocation rules.
- Azure tag inheritance, how to propagate subscription and resource group tags to child resources in Microsoft Cost Management.
- Azure resource naming and tagging decision guide, Microsoft's best-practice guide for designing a tagging taxonomy.
- US Federal Cloud Tagging Strategy Guide (CIO.gov), a detailed reference for naming conventions and tag governance, applicable beyond government contexts.
- FinOps School: cost attribution engine architecture, explains the ingestion-to-reconciliation pipeline architecture for building an attribution engine.
- Cloud cost attribution for microservices: 2026 guide (Koritsu AI), practical strategies for attribution in microservices architectures, including activity-based models and instrumentation patterns.
- What is cloud cost by team? (Koritsu AI), naming conventions, ownership mapping, and team-level cost views for UK engineering teams.
- Data centre infrastructure and cloud cost context (Anytime Fuel Pros), useful background on the physical infrastructure layer that underpins cloud provider costs, relevant when attributing data centre and energy-related charges.