FinOps Inform · Cost Optimisation
Cloud spend per service: a guide for CTOs and finance teams
Understand what is cloud spend per service and learn how to optimize your cloud budget. Discover strategies for cost-effective cloud management.

Cloud spend per service is the financial cost attributed to each individual cloud service your organisation runs, covering compute, storage, networking, databases, and every managed service in between. This granular breakdown is the foundation of any serious cloud budget allocation strategy. Without it, you are managing a total bill, not a cost structure. Tools like AWS Cost Explorer, Azure Cost Management, and CloudHealth exist precisely because this level of visibility is where real savings begin. This article explains how to measure, benchmark, and act on cloud spend per service in 2026.
What is cloud spend per service, and why does it matter?
Cloud spend per service is defined as the sum of all charges generated by a single cloud service within a billing period, isolated from the rest of your infrastructure. Cloud cost is the aggregate of spending across compute, storage, networking, observability, licensing, and third-party integrations. Breaking that aggregate down by service turns a single opaque invoice into a map you can act on.
The practical value is direct. When a finance executive sees that the total AWS bill rose by 18% last quarter, that number tells them nothing useful. When they see that managed database costs doubled while compute stayed flat, they know exactly where to look. Per-service visibility converts a financial signal into an engineering conversation.
For CTOs, the same data answers a different question: which architectural decisions are costing the most? A cloud expenditure report broken down by service connects infrastructure choices to their financial consequences, which is the only way to make those choices deliberately.

What are the primary cloud services and their typical cost components?
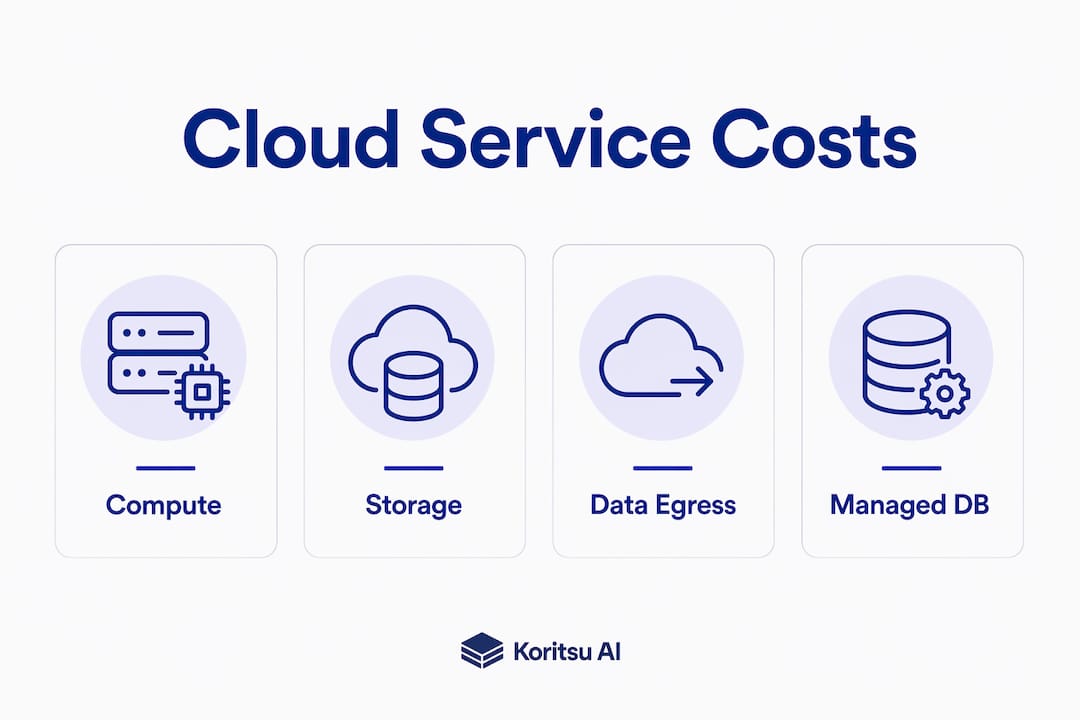
The major cost categories in any enterprise cloud environment are compute, storage, data egress, managed databases, and supporting infrastructure. Each has a distinct pricing structure, and each requires a different approach to control.
Compute is usually the largest single line item. Pricing models include on-demand (pay per second or hour), reserved instances (one or three year commitments), and spot or preemptible instances (spare capacity at steep discounts). Compute costs can be reduced by 30–72% through committed use discounts or reserved instances. That range reflects how much pricing model choice alone can shift your bill.
Storage splits into object storage (AWS S3, Google Cloud Storage), block storage (EBS, Persistent Disk), and archive tiers (Glacier, Coldline). Providers charge differently for each tier, and the cost gap between hot and cold storage is significant. Moving infrequently accessed data to archive tiers is one of the fastest wins in a cloud service cost analysis.
Data egress is the most misunderstood cost driver. AWS charges $0.09 per GB for data egress after the first 10TB per month. At scale, this becomes a material expense that many teams never model upfront.
Managed databases carry a substantial premium. Managed database services cost 2–3 times more than self-managed equivalents, because you are paying for high availability, automated backups, and failover. That premium is justified in production. In development and test environments, it rarely is.
Supporting infrastructure includes load balancers, NAT gateways, and monitoring agents. These are easy to overlook because they sit beneath the application layer, but they accumulate quickly.
Pro Tip: Map every service in your architecture to its pricing model before you run a cost breakdown. Teams that skip this step consistently underestimate egress and logging costs by a wide margin.
How can organisations accurately calculate cloud spend per service?
Calculating cloud spend per service accurately requires three things: consistent tagging, reliable billing data, and a method for handling costs that cannot be tagged.
-
Enable cost allocation tags across every resource. AWS, Google Cloud, and Azure all support tagging at the resource level. Tags should reflect service name, environment (production, staging, development), team, and cost centre. Without tags, billing reports aggregate costs in ways that are impossible to disaggregate later.
-
Pull data from native billing tools. AWS Cost Explorer, Azure Cost Management, and Google Cloud Billing all produce per-service breakdowns. Export these to a data warehouse like BigQuery or Redshift for cross-provider consolidation and historical trend analysis.
-
Account for untaggable infrastructure. This is where most cost breakdowns fail. AWS ECS Fargate environments incur roughly $90 per month in invisible overhead costs from Application Load Balancers, NAT gateways, and logging. These costs cannot be tagged to a specific service and must be modelled separately. Ignoring them creates systematic blind spots in your cloud expenditure report.
-
Use a FinOps tool for multi-cloud environments. Native tools work well within a single provider. Across AWS, Azure, and Google Cloud simultaneously, a third-party platform that normalises billing data into a single model is necessary for accurate per-service attribution.
-
Reconcile monthly. Costs shift as teams deploy new features, change instance types, or modify data pipelines. A monthly reconciliation between billing data and architecture diagrams catches drift before it compounds.
Pro Tip: Model data egress and reserved instance utilisation separately from your base compute costs. Teams that blend these into a single compute figure consistently overestimate their savings from reservations.
What are average cloud spend figures by service?
Benchmarking average cloud spend by service is useful, but the variation is wide enough that averages require context. The most reliable benchmark is waste. Enterprises waste 25–35% of their cloud budget on over-provisioned, idle, or suboptimal resources. That figure applies across all service types and represents the baseline opportunity in any cost breakdown.
The table below summarises typical cost characteristics and discount potential by service category.
| Service | Baseline pricing model | Discount potential | Key cost driver |
|---|---|---|---|
| Compute | On-demand per second | 30–72% via reservations | Instance type selection |
| Object storage | Per GB stored plus requests | 40–60% via tiering | Data volume and access frequency |
| Managed databases | Per instance hour plus storage | 30–50% via reserved instances | High-availability configuration |
| Data egress | Per GB transferred | Limited; architecture-dependent | Cross-region and internet transfers |
| Monitoring and logging | Per GB ingested | 20–40% via sampling and filtering | Telemetry verbosity |
Regional pricing adds another layer of variation. Asia-Pacific and South America regions are 10–30% more expensive than US or European equivalents for standard workloads. Oracle Cloud Infrastructure offers the lowest published prices for compute and data egress among the major providers, which matters for teams running workloads that are not deeply tied to AWS or Azure ecosystems.
The managed versus self-managed cost differential deserves particular attention. Managed database premiums represent quick optimisation targets in non-production environments. Switching a development database from Amazon RDS to a self-managed PostgreSQL instance on a smaller EC2 instance can cut that line item by more than half with minimal engineering effort.
How to interpret cloud spend per service to improve budgeting
Per-service cost data is only useful if it drives decisions. The discipline of turning billing data into budget decisions is what the FinOps Foundation calls cloud financial management, and it requires both engineering and finance to work from the same numbers.
The most effective cost-saving levers by service are:
- Compute: Right-size instances based on actual CPU and memory utilisation. Most teams provision for peak load and run at 20–40% utilisation the rest of the time. Right-sizing alone typically yields 15–30% savings on compute spend. A practical starting point is the idle resource guide for identifying which instances are candidates.
- Storage: Implement lifecycle policies that automatically move objects to cheaper tiers after a defined period. This requires no architectural change and produces immediate cost reductions.
- Databases: Audit non-production environments monthly. Managed database services in staging and development environments are a common source of unnecessary spend.
- Egress: Review cross-region data flows and CDN configurations. Architectural changes here require engineering time but often produce the largest single reductions.
- Monitoring: Reduce telemetry verbosity in non-critical services. Logging everything at DEBUG level in production is a common and expensive habit.
Cloud cost analysis is an operational discipline that requires bridging billing data with engineering architecture decisions. Cost spikes often arise from scaling events or architectural choices that are invisible in the billing console alone. Finance teams need engineers to explain what changed. Engineers need finance teams to quantify the impact. Neither group can do this effectively without per-service data as a shared reference point.
Optimisation efforts typically cost 5–10% of cloud spend and yield a return on investment of 3–5 times within a year. That ratio makes cloud cost management one of the highest-return operational investments available to a CTO or CFO. The cloud deployment cost checklist from Koritsu AI provides a practical framework for embedding cost governance into deployment workflows from the start.
Key takeaways
Cloud spend per service is the single most effective lens for identifying where cloud budgets are being wasted and where architectural decisions need to change.
| Point | Details |
|---|---|
| Define spend by service | Attribute every cloud cost to a specific service using tags, billing exports, and modelled overhead. |
| Benchmark against waste | Enterprises waste 25–35% of cloud budget; use this as your baseline for optimisation targets. |
| Model untaggable costs | Infrastructure overhead like NAT gateways and load balancers must be modelled separately to avoid blind spots. |
| Prioritise managed services in dev | Managed database premiums in non-production environments are the fastest optimisation wins. |
| Bridge finance and engineering | Per-service data only drives savings when finance and engineering teams interpret it together. |
The cost visibility problem is a process problem, not a technology problem
I have reviewed cloud billing data for organisations running on AWS, Google Cloud, and Azure, and the pattern is consistent. The teams with the highest waste are not the ones using the wrong tools. They are the ones where engineering and finance have never sat in the same room to look at the same numbers.
The technology for per-service cost visibility is mature. AWS Cost Explorer, Azure Cost Management, and third-party FinOps platforms give you the data. The gap is almost always interpretive. Finance sees a number. Engineering sees an architecture. Neither group has the vocabulary to connect the two without a shared framework built around per-service attribution.
The other pattern I see repeatedly is the assumption that reservations and committed use discounts are the primary savings lever. They are not. The largest savings come from fixing how software and infrastructure were built. Over-provisioned instances, verbose logging pipelines, managed databases running in development environments at full production cost, and cross-region data flows that were never designed with egress pricing in mind. These are engineering decisions with financial consequences that only become visible when you break the bill down by service.
My recommendation is to treat per-service cost data as a shared operational metric, reviewed monthly by both engineering leads and finance. Not as a finance report handed to engineering, and not as a technical briefing handed to finance. As a shared artefact that both teams are accountable for. That shift in process produces more savings than any single technical optimisation.
How Koritsu AI helps you act on per-service cloud costs
Understanding your cloud spend by service is the first step. Acting on it consistently is where most teams struggle.
Koritsu AI combines an AI platform that continuously analyses cloud spending with hands-on expert advice. Kori, our AI agent, surfaces exactly where money is being lost at the service level, across AWS, Google Cloud, and Azure. Our specialists help engineering teams act on those findings. The results are material: one UK enterprise achieved a 52% reduction in cloud costs after working with Koritsu AI to identify inefficiencies buried in their infrastructure architecture. Every engagement starts with a free assessment, and we take a share of the savings we actually find. Start your free assessment to see what your per-service breakdown reveals.
FAQ
What is cloud spend per service?
Cloud spend per service is the total cost attributed to a single cloud service, such as compute, storage, or a managed database, within a defined billing period. It gives organisations granular visibility into where their cloud budget is going.
How do I calculate cloud spending per service?
Use cost allocation tags on every cloud resource, export billing data from AWS Cost Explorer, Azure Cost Management, or Google Cloud Billing, and model any untaggable infrastructure overhead separately. Reconcile this data monthly against your architecture.
What percentage of cloud spend is typically wasted?
Enterprises waste 25–35% of their cloud budget on over-provisioned, idle, or suboptimal resources. Right-sizing compute alone typically recovers 15–30% of that waste.
Why are managed database costs so high?
Managed database services cost 2–3 times more than self-managed equivalents because providers charge for high availability, automated backups, and failover. This premium is rarely justified in development or test environments.
What is cloud spend per environment?
Cloud spend per environment is the total cost attributed to a specific deployment environment, such as production, staging, or development. It complements per-service analysis by revealing which environments carry disproportionate costs relative to their business value.