FinOps Inform · Cost Governance
Quarterly cloud spend review: a 90-day operating rhythm
Transform your cloud spend review quarterly process. Drive actionable insights with three key changes and boost financial efficiency.

The quarterly cloud spend review is not a reporting exercise. It is a 90-day operating rhythm that must deliver exactly three structural changes per quarter: one contract action, one workload right-placement, and one cost guardrail, plus a board-ready scorecard that Finance can act on without a translator. If your quarterly review produces a slide deck but no signed commitments, the process is broken.
To get started this week, run three things before your next calendar invite goes out:
- Pull your last three months of invoice or CUR exports and identify the top five services by absolute spend growth, not total spend.
- Block a 90-minute slot with your Engineering lead, FinOps lead, and Finance sponsor for the quarterly review, and assign a single directly responsible individual (DRI) to own the agenda.
- Circulate a short pre-read pack: a monthly variance summary, the top three unresolved actions from the previous quarter, and a nominated DRI list for each open item.
Those three steps take less than a day. They are also the difference between a review that produces decisions and one that produces discussion.
What does a quarterly cloud spend review actually achieve?
The quarterly review is the structural checkpoint in a 90-day cloud cost operating rhythm. It sits above the daily alerting, weekly rightsizing checks, and monthly variance reviews that keep spend from drifting unnoticed. Where monthly reviews surface the top three variances in roughly 45 minutes, the quarterly review exists to make decisions that monthly cadence cannot: renegotiating a commitment, migrating a workload, or deploying a spend guardrail that requires cross-team sign-off.
The core goals are alignment, institutionalisation, and re-baselining. Engineering, FinOps, and Finance must leave the meeting with the same understanding of what was spent, why it grew, and what will change. Optimisation must be institutionalised, meaning it cannot depend on one person remembering to check the bill. And the forecast must be re-baselined against actual consumption so the next quarter's budget is grounded in evidence, not last year's assumptions.
Success criteria worth tracking include: percentage of committed savings verified against billing (not just modelled), number of guardrails deployed and active, forecast variance reduction quarter-on-quarter, and whether a board-ready one-pager was produced and circulated within 48 hours of the meeting. The UK government's Spending Review 2025 sets cross-departmental cost-control expectations that make this kind of evidence-based cloud governance increasingly non-negotiable for public-sector and regulated organisations. Private-sector CFOs are asking the same questions.
What data do you need to prepare before the meeting?
The quarterly review fails when the first 30 minutes are spent arguing about whose numbers are right. Preparation eliminates that. You need six datasets, each with a defined owner and a required time range.
| Dataset | Owner | Time range / granularity |
|---|---|---|
| Invoice or CUR/CUD exports | FinOps lead | Rolling 90 days, daily granularity |
| Resource inventory and utilisation metrics | Engineering lead | Rolling 90 days, per-service |
| Commitment inventory (reservations, savings plans, CUDs) | FinOps lead | Current state plus full forward view |
| Purchase orders and contract terms | Procurement / Finance | Current active contracts |
| Topology and ownership map (account-to-team) | Engineering lead | Current state |
| Unit economics (cost per inference, cost per request) | FinOps lead | Rolling 90 days, per workload |

Data normalisation is where most teams lose time. Apply consistent account mapping so that spend is always expressed at team or workload level, not just at account or project level. Unify units for network egress and observability: GB transferred and GB ingested are not interchangeable, and mixing them produces misleading totals. Express unit economics in the same denominator across workloads so you can compare cost per inference for your ML pipeline against cost per API request for your platform services.
Tagging readiness is the most common blocker. Before the meeting, confirm that every resource carrying more than 1% of total spend has a valid team tag and a valid workload tag. For anything untagged, fall back to account-level allocation rather than leaving spend in an "unallocated" bucket that Finance cannot interrogate.
Pro Tip: If your tagging coverage is below 80%, do not delay the review. Allocate untagged spend proportionally to the accounts that own the surrounding resources, document the assumption, and add a tagging remediation action to the quarterly backlog. A review with imperfect data and a documented fallback is far more useful than no review at all.
For deeper guidance on cloud cost governance frameworks and ownership models, the Koritsu blog covers escalation paths and DRI assignment in detail.
How should you structure the 90-minute quarterly review meeting?
The quarterly review fits into a three-tier cadence: daily automated alerts catch anomalies within hours, monthly variance reviews (roughly 45 minutes) surface the top three cost movements, and the quarterly review makes the structural decisions that require cross-functional authority. Annual reviews, which run multiple workstreams including architecture optimisation and contract strategy, depend on the quarterly process having already decomposed spend and validated commitments throughout the year.

A 90–120 minute timebox works because it forces prioritisation. If a topic cannot be resolved in the time allocated, it either needs a pre-read that was not circulated, or it is not a quarterly-level decision.
Suggested attendees and their direct responsibilities:
- Engineering lead (DRI): owns workload performance data, right-placement proposals, and guardrail implementation commitments.
- FinOps lead (DRI): owns the variance report, commitment inventory, unit economics, and the board-ready scorecard.
- Finance sponsor: owns budget alignment, forecast sign-off, and escalation authority for contract actions.
- Procurement or legal (as needed): joins only when a contract renegotiation or new commitment requires sign-off authority.
Timed agenda template:
- 0–10 min: Setup and pre-read confirmation. Confirm all attendees have read the variance report and action log. Flag any data disputes immediately so they do not consume decision time.
- 10–35 min: Top variances and root cause. Walk through the top five services by spend growth. Each variance needs a root-cause owner and a disposition: accept, optimise, or escalate.
- 35–60 min: Three quarterly decisions. One contract action (renegotiation, new commitment, or commitment right-sizing). One workload right-placement (migration, rightsizing, or architecture change). One guardrail (budget alert, policy, or automated shutdown).
- 60–80 min: Escalation items. Any unresolved items from the previous quarter's backlog that have not been closed. Assign a new DRI or escalate to Finance sponsor.
- 80–90 min: Board summary closure. FinOps lead reads the one-page executive summary aloud. Attendees confirm the numbers and the three committed actions before the meeting closes.
Pre-reads must be circulated at least 48 hours before the meeting: the variance report, the action log with DRI status, the contract brief for any commitment under review, and the workload performance summary. Late pre-reads produce late decisions.
Which KPIs should drive the quarterly conversation?
The metrics that matter at quarterly level are the ones that surface structural issues, not operational noise. Operational signals belong in the monthly cadence.
Primary KPIs to report at every quarterly review:
- Total cloud spend by category (compute, storage, network, AI/ML, observability): shows where the budget is actually going, not where it was planned to go.
- Spend growth rate quarter-on-quarter: calculated as (current quarter spend minus prior quarter spend) divided by prior quarter spend. A growth rate above your revenue growth rate is a structural signal, not a seasonal one.
- Cost per inference / cost per request / cost per customer: unit economics that connect engineering decisions to financial outcomes. Compute as total workload cost divided by the relevant volume metric for the period.
- Egress GBs by destination: separates inter-region, internet, and CDN egress so you can identify architectural waste versus legitimate traffic growth.
- Observability spend per environment: production, staging, and development environments should have materially different observability costs. If staging costs as much as production to monitor, that is a guardrail failure.
- Commitment utilisation rate: actual usage of reserved capacity divided by purchased capacity. Below 80% indicates over-commitment; above 95% may indicate under-commitment leaving on-demand premium on the table.
- Commitment coverage ratio: percentage of eligible on-demand spend covered by a commitment. This feeds directly into the contract action decision.
The FinOps Foundation's KPI benchmarking framework provides reference ranges for commitment utilisation and coverage ratios that are worth calibrating against your own figures. Commitment utilisation and coverage ratios feed the contract action decision. Unit economics and egress GBs feed the workload right-placement decision. Observability spend per environment feeds the guardrail decision. Spend growth rate and total spend by category feed the board scorecard.
What reports and tools do you need for a consistent quarterly review?
The goal is a single authoritative dataset that every attendee trusts. That requires stitching together provider-native exports and any FinOps platform outputs before the meeting, not during it.
Tool categories to have in place:
- Native billing exports: AWS Cost and Usage Report (CUR), Google Cloud billing export to BigQuery, or Azure Cost Management exports. These are the source of truth. Google Cloud recommends exporting detailed usage and billing data to BigQuery for deeper analysis, custom dashboards, and automated alerts. AWS Cost Explorer and CUR exports provide commitment utilisation, anomaly detection, and budget controls natively.
- BI and analytics layer: Looker Studio, Power BI, or a comparable tool sitting on top of BigQuery or your data warehouse. This is where account-to-team mapping and unit economics calculations live.
- Automated anomaly detection: either provider-native (AWS Cost Anomaly Detection, GCP Budget Alerts) or a FinOps platform layer. Anomalies identified before the quarterly meeting should already have a root-cause note attached.
- FinOps platform (optional but useful at scale): centralises multi-cloud data, automates tagging enforcement, and produces commitment recommendations. Evaluate on raw export availability, account-to-team mapping ease, and auditability.
The minimum report checklist for every quarterly review:
- Variance vs forecast for the quarter, by service and by team
- Top 10 services by absolute spend and by growth rate
- Commitments inventory: purchased, utilisation rate, coverage ratio, and expiry dates
- Workload performance summary: unit economics, rightsizing recommendations, and migration candidates
- One-page executive scorecard: total spend, growth rate, three committed actions, and forecast for next quarter
The cloud spending audit checklist on the Koritsu blog provides a practical template aligned with these report types.
Annual reviews, which decompose spend across multiple workstreams and produce optimisation playbooks, depend on the quarterly process having already validated commitments and unit economics throughout the year. The quarterly cadence is what makes the annual AWS cost review tractable rather than a scramble.
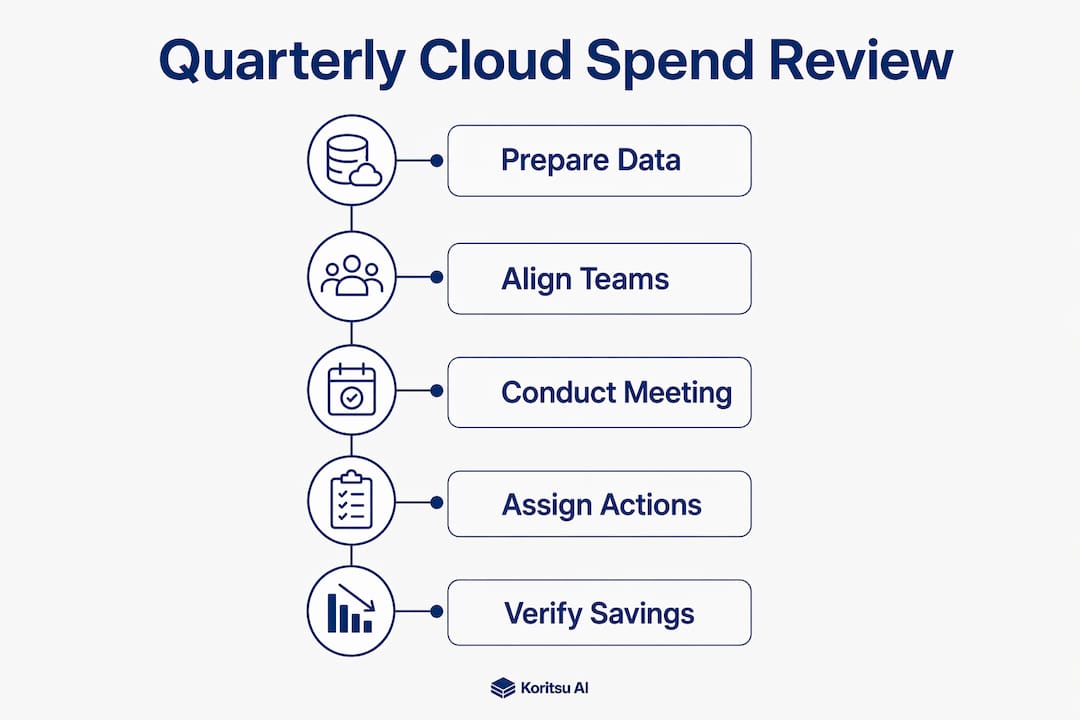
How do you run the quarterly review from month one to close?
The 90-day cycle has three distinct phases. Each has specific outputs and owners.
Month 1: Select and baseline
- Pull the full dataset (see the data table above). Confirm tagging coverage and apply fallback allocations where needed.
- Run the quarterly review meeting using the timed agenda above.
- Select the three quarterly actions: one contract action, one workload right-placement, one guardrail. Assign a DRI and a target completion date to each.
- Baseline the current spend for each action so savings can be measured against a fixed reference point.
- Update the rolling forecast for the next 90 days based on the committed actions and known growth drivers.
- Schedule the month-2 mid-quarter check (30 minutes, DRIs only) and the month-3 close meeting.
Month 2: Execute and monitor
- DRIs execute their assigned actions. Engineering lead implements the workload change or guardrail. FinOps lead progresses the contract action with procurement.
- Run the mid-quarter check: confirm each action is on track, surface any blockers, and escalate to Finance sponsor if a contract action is stalling.
- Update the rolling forecast if actual spend is deviating from the month-1 projection by more than 5%.
- Flag any new anomalies that emerged after the quarterly meeting and assign a disposition (accept, optimise, or carry to next quarter).
Month 3: Close and verify
- Collect billing data for the full quarter and compare against the month-1 baseline for each committed action.
- Calculate realised savings for each action using the verification approach described in the next section.
- Prepare the board-ready one-pager: total spend, growth rate, realised savings, three completed actions, and the forecast for the next quarter.
- Run the close meeting (30 minutes): confirm verified savings, close completed actions, carry unresolved items to the next quarter's backlog with a new DRI.
- Schedule the next quarter's review meeting and circulate the updated action log.
Escalation rule: any action that has not progressed by the end of month 2 must be escalated to the Finance sponsor. If it remains unresolved at month-3 close, it moves to the quarterly backlog with a documented reason and a new owner.
What outputs should you expect, and how do you verify realised savings?
The quarterly review produces five deliverables: a signed contract action, a completed workload right-placement, a deployed guardrail, a one-page executive summary, and an updated rolling forecast. If any of these is missing at close, the quarter is incomplete.
Verifying realised savings is where most teams make mistakes. The most common errors are double-counting, baseline drift, and attributing seasonal demand reduction to an engineering change.
The verification approach has four steps:
- Define the baseline. Lock the 30-day average spend for the specific service or workload before the action was taken. Document the date the baseline was set and the tagging state at that point.
- Set the measurement window. Measure savings over the 30 days immediately following full implementation of the action, not from the day the ticket was opened.
- Reconcile against billing. Compare the measurement-window spend against the baseline using the same cost allocation rules. If tagging changed during the quarter, restate both periods using the new allocation to avoid phantom savings.
- Attribute and document. Record the saving against the specific action, the DRI, and the KPI it was designed to move. Savings that cannot be attributed to a specific action are not verified savings.
Structured quarterly reviews capture an additional 8–15% in annual savings compared to ad-hoc or contract-renewal-driven optimisation alone. That figure only holds when savings are verified against billing, not modelled. Modelled savings that are never reconciled against the bill are the single biggest source of inflated cloud cost reduction claims.
For translating verified savings into board-level ROI narratives, the Koritsu blog's cloud infrastructure ROI examples for CTOs covers the framing in detail.
Why AI inference, egress, and observability deserve their own portfolio view
Practitioner audits consistently show that AI inference, network egress, and observability are the three line items that most frequently explain mid-year cloud bill growth. They also compound: a new ML feature increases inference costs, which increases logging volume, which increases observability spend, which increases egress if telemetry is shipped cross-region. Reviewing them in isolation misses the compounding effect entirely.
The portfolio approach means treating these three cost drivers as a single optimisation unit in the quarterly review. Build a one-page portfolio view that shows inference cost per model call, egress cost per GB by destination, and observability cost per environment side by side. Calculate a combined unit cost per inference that includes the downstream egress and telemetry overhead. That single number tells you whether a new AI feature is economically viable at scale before you commit to the architecture.
Koritsu AI has observed this pattern repeatedly in client engagements. In one case, a UK financial services group reduced its AWS Lambda bill by 96% through architectural changes that addressed the compounding relationship between function invocation frequency, logging volume, and downstream data transfer. The saving was not visible at the service level; it only became apparent when the three cost drivers were reviewed together. A UK bidding platform achieved a 52% reduction in cloud costs through a similar portfolio-level analysis that identified egress and observability as the primary growth drivers, not compute.
The practical barriers to this approach are measurement and ownership. Inference costs sit with the ML team, egress with the platform team, and observability with the SRE team. No single DRI owns all three. The mitigation is to assign the portfolio view to the FinOps lead and require each team to contribute their unit economics to a shared dataset before the quarterly meeting. The benefits of cloud observability for cost are only realisable when observability data feeds the cost review, not just the incident response process.
Pro Tip: Build a single shared spreadsheet or BI view that pulls inference, egress, and observability costs into one tab, normalised to a common time period. Share it with all three team leads two weeks before the quarterly review so disputes about the numbers are resolved before the meeting, not during it.
Key takeaways
A well-run cloud spend review quarterly process delivers three verified structural changes per quarter and a board-ready scorecard, with savings confirmed against billing rather than modelled projections.
| Point | Details |
|---|---|
| Three actions per quarter | Commit to exactly one contract action, one workload right-placement, and one guardrail per 90-day cycle. |
| Verify savings against billing | Lock a pre-action baseline, measure over a 30-day post-implementation window, and reconcile against actual billing data. |
| Portfolio the three growth drivers | Review AI inference, egress, and observability as a single cost portfolio to capture compounding savings. |
| Structured reviews outperform ad-hoc | Structured quarterly reviews capture an additional 8–15% in annual savings versus contract-renewal-only optimisation. |
| Koritsu AI as implementation path | Koritsu AI's AI-driven platform and success-fee model help teams run and verify the quarterly process without upfront cost. |
The quarterly review is a process problem, not a technology problem
The teams that get the most from a quarterly cloud spend review are not the ones with the most sophisticated tooling. They are the ones that treat the review as a governance commitment, not a finance team deliverable. The distinction matters more than it sounds.
What we see repeatedly is that organisations invest in FinOps platforms, build dashboards, and then hold a quarterly meeting where the conversation circles around data quality rather than decisions. The root cause is almost always the same: no single owner for the pre-read pack, no fixed agenda, and no rule that limits the meeting to three decisions. When everything is on the table, nothing gets decided.
The 90-day rhythm works because it constrains ambition. One contract action, one right-placement, one guardrail. That is not a limitation; it is a forcing function. Teams that try to close ten actions per quarter close none of them reliably. Teams that commit to three close all three, verify the savings, and carry momentum into the next cycle.
The GOV.UK guidance on managing cloud spending makes the same point from a public-sector perspective: governance cadence and ownership clarity are the prerequisites for cost control, not the tools. The tools are only as good as the process they serve.
The AI inference, egress, and observability portfolio view is the single most underused lever in quarterly reviews right now. Most teams review these in separate conversations with separate owners. The compounding relationship between them means that optimising one without the others often produces savings that are immediately offset by growth in the adjacent line items. Reviewing them together, with a shared unit economics view, is where the structural savings actually live.
How Koritsu AI can help you run a quarterly cloud spend review
Most of the savings buried in your cloud bill are not in your commitment discounts. They are in how your workloads were built and how your costs compound across inference, egress, and observability. Koritsu AI surfaces exactly those inefficiencies through continuous AI-driven analysis, then helps your engineering team act on them.

The engagement model is designed for teams that cannot afford to wait for a contract renewal cycle. Koritsu AI starts with a free assessment, then charges a share of the savings actually verified against your billing data. No upfront fee, no savings claimed before they appear in the bill. From there, teams move to an ongoing subscription that keeps the quarterly rhythm running with Kori, our AI agent, monitoring spend continuously between reviews.
Koritsu AI has helped a UK financial services group significantly reduce its AWS Lambda bill and a UK bidding platform substantially lower total cloud costs, both through the portfolio-level analysis that a structured quarterly review makes possible. If you want to run a pilot 90-day review with Koritsu AI's platform and FinOps specialists supporting the process, start with a free assessment to see where your bill is growing and why.
Useful sources and further reading
For teams implementing or refining their quarterly cloud expenditure review, these sources provide authoritative guidance on governance, tooling, and verification:
- Managing your spending in the cloud (GOV.UK): the UK government's primary guidance on cloud cost governance for public-sector and regulated organisations. Consult this for policy alignment and departmental cost-control expectations.
- AWS Cloud Financial Management: reference for CUR exports, Cost Explorer, Budgets, and anomaly detection. Use when configuring your AWS reporting stack for the quarterly review.
- Google Cloud Cost Management: reference for BigQuery billing exports, budget alerts, and commitment utilisation. Use when building your GCP analytics layer.
- FinOps Foundation KPI benchmarking: reference ranges for commitment utilisation, coverage ratios, and maturity metrics. Use to calibrate your quarterly KPIs against industry benchmarks.
- FinOps Foundation state of FinOps 2025 report: practitioner survey data on adoption, tooling, and savings outcomes. Use for benchmarking your maturity and prioritising quarterly actions.
- Koritsu AI: how to reduce cloud infrastructure costs: practical tactics and execution templates for institutionalising optimisation across the 90-day cycle.
- Koritsu AI: cloud spending audit checklist for CTOs: a structured checklist aligned with the quarterly review pre-read and meeting inputs described in this article.
- Koritsu AI: align cloud costs with business outcomes: guidance on presenting verified savings and the board-ready scorecard to Finance and executive stakeholders.