FinOps Inform · TCO
Cloud total cost of ownership explained for IT leaders
Discover the real costs of cloud services with our guide on cloud total cost of ownership explained. Learn to optimize your IT budget!

Most enterprises discover their cloud bill is higher than projected not when they sign the contract, but six months into production. Cloud total cost of ownership explained properly goes far beyond what any pricing calculator surfaces. There are egress charges, operational overheads, licensing fees, and architectural inefficiencies quietly compounding every month. If your finance and engineering teams are still treating TCO as a procurement exercise rather than a continuous discipline, this guide will reframe how you think about every pound you spend in the cloud.
Key takeaways
| Point | Details |
|---|---|
| TCO goes beyond compute costs | Compute accounts for 35–50% of spend; egress, support, and operations consume the rest. |
| Egress charges are persistently underestimated | AWS outbound egress runs $0.08–$0.09 per GB and can produce four-figure monthly surprises. |
| Migration costs extend the payback period | Dual-running on-prem and cloud simultaneously for 3–6 months materially inflates your real transition cost. |
| Tagging errors corrupt your model | Tags are not retroactive and can delay cost reporting by 24 hours, distorting allocation decisions. |
| TCO is a continuous process | AI tools like Amazon Q now enable fast natural-language cost queries, making ongoing monitoring accessible for finance and engineering teams alike. |
Breaking down cloud TCO into core categories
Understanding cloud expenses starts with accepting that the headline price is not the total price. Cloud providers present compute and storage figures prominently because those numbers look manageable. The full picture is considerably more complex.
Here is how cloud ownership costs typically distribute across categories:
| Category | Examples | Typical share of total spend |
|---|---|---|
| Direct infrastructure | Compute, storage, managed databases, CDN | 35–50% |
| Data transfer and network | Outbound egress, cross-AZ traffic, VPN | 12–25% |
| Operational overhead | Engineering hours, monitoring tools, incident response | 15–25% |
| Licensing and support | OS licences, third-party software, provider support tiers | 10–20% |
| Governance and security | IAM tooling, compliance auditing, SIEM integration | 5–10% |
Compute and data transfer alone can account for nearly three-quarters of total cloud spend before you factor in a single engineer's time. The categories most organisations underestimate are operational overhead and licensing, precisely because they do not appear on a cloud provider invoice.
The operational overhead figure deserves particular attention. A typical DevOps structure sees one engineer managing $600K–$900K in cloud spend. That engineering cost does not show up in your AWS console, but it belongs in every TCO model you build.
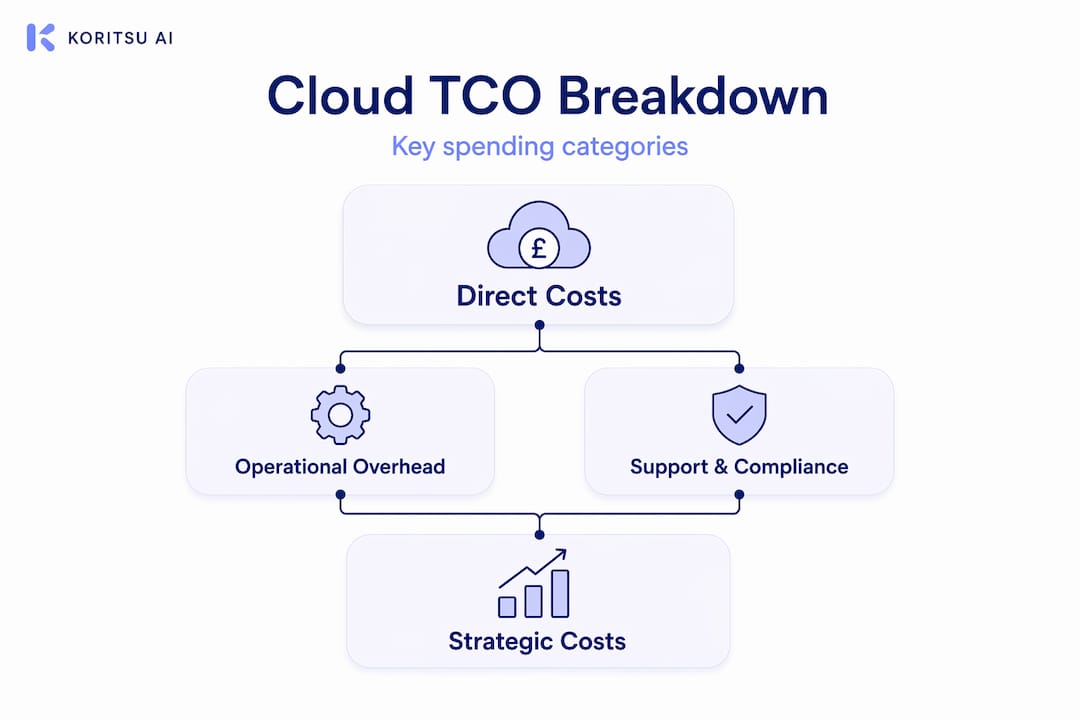
Strategic costs, including cloud provider support contracts, security tooling, and compliance work, are similarly invisible until they are not. A business-level AWS support plan adds 10% to compute spend. Enterprise support goes higher. These are not optional for production workloads, yet many initial cloud cost analyses omit them entirely.
Hidden costs in cloud TCO that erode budgets
The most damaging cloud cost surprises share a common trait: they were predictable, but nobody modelled them. Here are the categories that most frequently cause budget overruns.
- Data egress. AWS outbound egress costs $0.08–$0.09 per GB and produces four-figure monthly bills at scale for data-intensive workloads. What makes this particularly problematic is that egress is architectural. Cross-availability-zone traffic, service fan-out patterns, and replication strategies multiply your egress bill beyond simple volume calculations. Two services exchanging data across AZs pay for every byte, twice.
- Migration and dual-running costs. Most transitions involve running on-premises and cloud environments simultaneously for three to six months. That parallel spend, combined with migration tooling licences and retraining, often consumes the projected first-year cloud savings entirely.
- Operational management costs. Incident response, patching, monitoring configuration, and continuous optimisation all consume engineering time. This is real labour cost that belongs in your TCO calculation.
- Third-party licensing fees. Bring-your-own-licence (BYOL) configurations are often mis-configured. SQL Server, Oracle, and Windows Server licences can exceed compute costs on certain workloads.
- Support tier costs. Moving from developer-level to business-level support can add thousands per month. Most organisations discover they need it after their first serious incident.
"Cloud pricing calculators exclude many indirect costs including migration, training, ongoing optimisation, and hidden fees — experts recommend augmenting calculator outputs with multi-year operational and transition costs."
Pro Tip: Model your egress costs before you finalise your architecture. Sketch out your inter-service communication patterns and estimate data volumes at steady-state load. It takes a few hours and can prevent a multi-thousand-pound monthly surprise.
Cloud TCO across AWS, Azure, and Google Cloud in 2026
Provider choice materially affects TCO. Not because one provider is categorically cheaper, but because the cost profile of each suits different workload and organisational profiles. A cloud pricing breakdown across the three major providers reveals meaningful structural differences.

| Cost dimension | AWS | Azure | Google Cloud |
|---|---|---|---|
| Compute baseline pricing | Market standard | Competitive, strong Windows pricing | Typically 10–15% lower on comparable VMs |
| Egress charges | $0.08–$0.09/GB outbound | Similar to AWS | Lower tiered rates for high-volume customers |
| Discount model | Reserved Instances, Savings Plans | Reserved Instances, Hybrid Benefit | Committed Use Discounts, sustained use discounts |
| Licensing advantage | Limited | Azure Hybrid Benefit for Windows/SQL | Limited |
| Operational tooling | Most mature ecosystem | Strong for Microsoft-heavy orgs | Strong for data/ML workloads |
| Support tiers | Developer to Enterprise | Developer to Premier | Basic to Enhanced |
Azure's Hybrid Benefit is a genuine TCO differentiator for organisations already running Windows Server or SQL Server licences. It can reduce Windows VM costs by up to 40% compared with paying for the licence through the cloud provider. If your estate is Microsoft-heavy and you have active Software Assurance, Azure's TCO in cloud computing calculations will likely tilt in its favour.
Google Cloud's sustained use discounts apply automatically without reservation, which simplifies financial planning for workloads with unpredictable ramp profiles. For data-intensive workloads, Google's lower egress pricing can also reduce network costs significantly compared with AWS at scale.
AWS remains the most mature ecosystem, with the broadest managed service catalogue. However, that breadth creates its own TCO risk. Organisations using many AWS-native managed services face higher vendor lock-in costs and migration complexity if they ever need to move.
How to model and optimise your cloud TCO
A sound TCO model is not a one-time spreadsheet exercise. It is a living framework that evolves with your workload. Here is a practical approach.
- Define your workload baseline. Catalogue every service, its average utilisation, and its data transfer patterns. Use your provider's native pricing calculator as a starting point, but treat it as a floor, not a ceiling.
- Add operational and migration costs explicitly. Include engineering hours for management and incident response. If you are migrating, add dual-running costs for the full transition period. Cloud pricing calculators systematically exclude these costs, so you must add them manually.
- Activate and enforce tagging from day one. Cost tags are not retroactive and reporting can lag by up to 24 hours. Any resource deployed without tags is effectively unaccounted for until someone audits it. Build tag enforcement into your infrastructure-as-code templates and deployment pipelines.
- Leverage AI-powered cost analysis tools. AWS Cost Explorer now includes AI-powered cost analysis via Amazon Q, enabling natural-language queries against your spend data. This makes continuous cloud cost analysis accessible without requiring a dedicated FinOps engineer to interpret every anomaly.
- Establish a FinOps review cadence. Assign ownership of cost categories to engineering teams. Monthly reviews that connect spend to business outcomes are far more effective than quarterly finance audits that react to surprises.
Pro Tip: Avoid the trap of rightsizing purely on CPU utilisation. Memory, I/O throughput, and network bandwidth all influence the optimal instance type. A workload that looks undersized on CPU may already be constrained by memory, making a vertical resize counterproductive.
AI-powered tools democratise cloud finance insights, closing the gap between engineering decisions and financial accountability. The organisations that get cloud cost under control are the ones that make cost visibility a shared responsibility across finance and engineering, not a handoff between them.
Strategic risks and trade-offs in cloud TCO decisions
A TCO model that only captures costs is incomplete. Strategic risks have real financial weight, even when they do not appear on an invoice.
- Vendor lock-in. The deeper your reliance on provider-native services such as serverless orchestrators, proprietary databases, or managed AI services, the higher your eventual migration cost. Migration cost surges beyond initial savings projections are a common trigger for regret in multi-year cloud commitments.
- Cost volatility. Cloud spend is inherently variable. A poorly scoped auto-scaling policy or an unexpected traffic spike can produce a bill that bears no resemblance to your model. Managing cost volatility is a CFO-level concern, not just an engineering problem.
- Agility versus cost control. The cloud's speed advantage is real. Faster infrastructure provisioning and shorter release cycles generate business value that pure cost analysis cannot fully capture. The trade-off is that agility without guardrails produces runaway spend.
- Multi-cloud and hybrid overhead. Running workloads across multiple providers or maintaining a hybrid on-premises footprint creates operational complexity that multiplies engineering overhead. The cost of managing two toolchains, two security models, and two billing systems is rarely modelled upfront.
- Opportunity cost of inaction. Failing to optimise cloud TCO is not a neutral position. Engineering teams that spend time managing cost inefficiencies are not building product. The indirect cost of that distraction belongs in any honest TCO assessment.
Vendor calculators focus primarily on infrastructure and systematically understate the operational and strategic costs that determine whether a cloud investment delivers its expected return.
My perspective on where cloud TCO analysis goes wrong
I have reviewed enough cloud accounts to say with confidence that the problem is almost never the provider's pricing. It is the model organisations use to understand their own costs.
The most common failure I see is treating cloud TCO as a pre-migration exercise rather than an ongoing discipline. Teams build a solid model, migrate, and then stop looking. Six months later, the architecture has drifted, new services have been provisioned without tagging, and egress costs have tripled because someone introduced a cross-AZ caching pattern that nobody priced.
The second failure is the finance and engineering divide. Finance sees a cloud bill and asks for reductions. Engineering sees a performance requirement and adds resources. Without a shared allocation model and regular joint reviews, those two conversations never connect. The result is that both teams are frustrated and the bill keeps growing.
What actually works is making cloud cost analysis a product of your engineering culture, not your finance cycle. The organisations I have seen achieve meaningful, sustained reductions treat every architectural decision as a cost decision. They use tools like Koritsu's AI platform to surface inefficiencies continuously, not quarterly. And they hold engineering teams accountable for the cost of what they build, not just the performance.
Cloud cost is not a technology problem. It is a process problem. Fix the process and the numbers follow.
How Koritsu can reduce your cloud ownership costs

If this guide has confirmed what you already suspected, that your cloud TCO model is missing critical costs, Koritsu can help you find them. Koritsu's AI agent, Kori, continuously analyses your cloud spend across AWS, Azure, and Google Cloud, surfacing the inefficiencies buried in your architecture and configuration. One UK bidding platform cut cloud costs by 52% after Koritsu identified structural inefficiencies that no pricing calculator had flagged. You can start with a free assessment and only pay when real savings are confirmed.
FAQ
What does cloud total cost of ownership include?
Cloud TCO includes direct infrastructure costs such as compute, storage, and network, as well as operational overheads such as engineering time, monitoring, and incident management, plus licensing, support tiers, security tooling, and data egress charges. Pricing calculators capture only the first category.
Why are cloud costs higher than the original estimate?
Most estimates rely on provider pricing calculators that exclude migration, training, and ongoing optimisation costs. Dual-running costs during migration and unmodelled egress charges are the two most frequent causes of first-year budget overruns.
How do AWS, Azure, and Google Cloud differ on TCO?
Azure offers cost advantages for Microsoft-heavy organisations through its Hybrid Benefit programme. Google Cloud typically offers lower egress rates at volume and automatic sustained-use discounts. AWS has the broadest service catalogue but carries higher lock-in risk for organisations using proprietary managed services.
How should I model egress costs accurately?
Map your inter-service communication patterns and identify any cross-AZ data flows, replication jobs, or service fan-out architectures. Architectural patterns multiply egress bills beyond simple volume estimates, so model at the service level rather than total gigabytes transferred.
What is the best way to maintain cloud TCO accuracy over time?
Enforce tagging in your infrastructure-as-code pipelines from day one, establish monthly FinOps reviews with shared accountability across finance and engineering, and use AI-powered tools such as Amazon Q in AWS Cost Explorer to detect anomalies quickly rather than waiting for quarterly finance audits.