FinOps Inform · API Cost Optimisation
How to optimise API calls in cloud services
Discover how to optimise API calls in cloud services with rate limiting, caching, batching, and monitoring techniques that cut latency and reduce cloud costs.

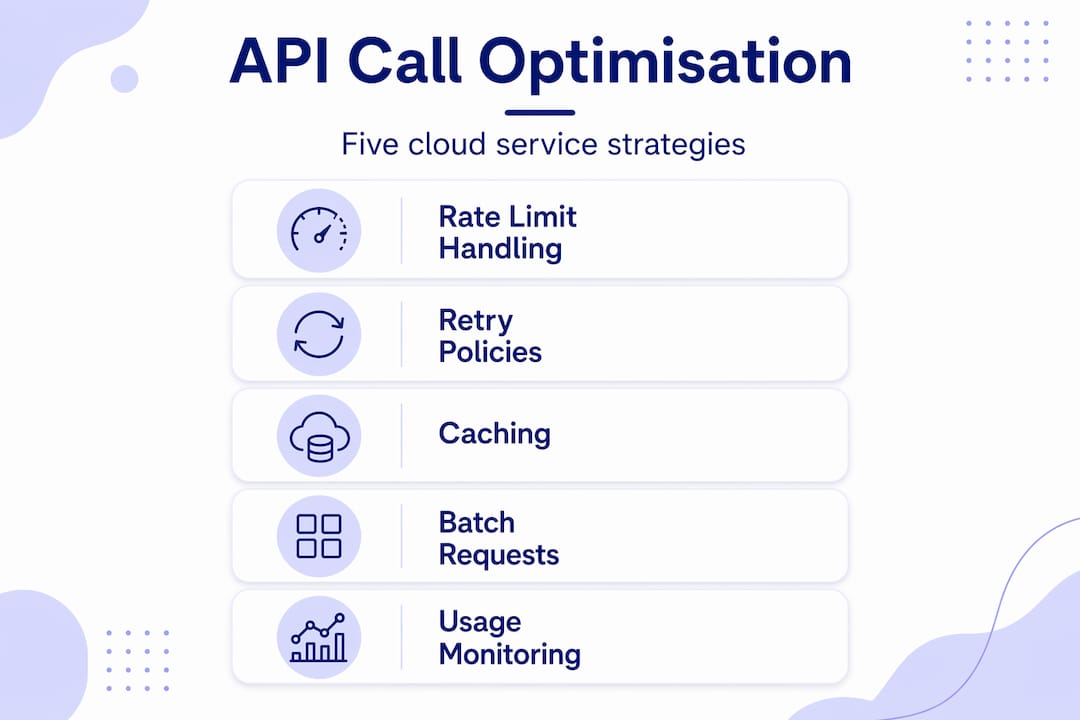
Inefficient API calls are one of the most overlooked sources of runaway cloud costs and degraded application performance. Every unnecessary request, uncompressed payload, or poorly handled retry adds latency and charges to your bill. If you are trying to optimise API calls in cloud services, the fixes are rarely exotic. They are systematic. This article walks through the preparation, execution, and verification steps that engineering teams can apply immediately: rate limit handling, intelligent queuing, caching, batching, and continuous monitoring. Each section gives you something concrete to act on.
Key takeaways
| Point | Details |
|---|---|
| Handle rate limits proactively | Implement 429 error handling with Retry-After headers and exponential backoff to prevent retry storms. |
| Tune queue concurrency carefully | Calculate effective throughput as the minimum of dispatch rate and concurrency divided by task duration. |
| Compress and cache aggressively | Enabling gzip or Brotli compression can reduce JSON payload size by 70 to 90 per cent. |
| Batch requests where latency allows | Consolidating API calls into bulk operations reduces per-request cost and total call volume significantly. |
| Monitor continuously and iterate | Tracking rate limit headers, error rates, and payload sizes over time surfaces the next optimisation opportunity. |
Optimise API calls in cloud services: know your limits first
Before you write a single line of retry logic, you need to understand what the API provider actually enforces. Rate limits define how many requests a client can make per second or per minute. Quota policies define how many requests are allowed per day or per month. Exceeding either triggers a 429 Too Many Requests response, and how your application handles that response determines whether you have a minor slowdown or a cascading failure.
Most cloud APIs return a Retry-After header with the 429 response. This header tells your client exactly how long to wait before retrying. Handling 429 errors correctly means reading that value, waiting the specified duration (typically 5 to 120 seconds), and adding a small random jitter to prevent multiple clients from retrying in lockstep. If the header is absent, fall back to exponential backoff.
Idempotency is the other concept you must get right before building retry logic. A request is idempotent if sending it multiple times produces the same result as sending it once. GET requests are idempotent by definition. POST requests often are not. Using idempotency keys for POST requests lets you retry safely without duplicating side effects such as creating duplicate records or triggering duplicate payments.
Key things to audit before you start optimising:
- Which endpoints are rate-limited, and at what thresholds?
- Does the API return
Retry-Afterconsistently, or only sometimes? - Are your POST requests idempotent, and do you pass idempotency keys?
- Are you distinguishing between transient failures (worth retrying) and permanent ones (not worth retrying)?
- Do you have a maximum retry budget, or could retries run indefinitely?
Pro Tip: Set a hard maximum retry count at the application boundary. Unlimited retries under a degraded API can exhaust your thread pool and bring down services that have nothing to do with the failing endpoint.
Intelligent rate limiting and request queuing
Once you understand the limits, the next step is building infrastructure that respects them automatically. The naive approach is to let each service instance manage its own rate limiting locally. This works when you have a single instance, but it breaks immediately when you scale horizontally. Each new instance adds its own request stream, and the combined throughput exceeds the API quota without any single instance being aware of the problem.
Distributed rate limiting solves this by sharing state across instances using a data store such as Redis with atomic operations. Every instance checks and updates a shared counter before dispatching a request. This adds a small amount of latency per call, but it is far cheaper than dealing with cascading 429 errors across your fleet.

For asynchronous workloads, cloud task queues are a more practical solution. Google Cloud Tasks, for example, lets you configure max-dispatches-per-second and max-concurrent-dispatches at the queue level. The effective throughput of the queue is not simply the dispatch rate. Effective throughput equals the minimum of the dispatch rate and the concurrency divided by the average task duration. If your tasks take two seconds each and you allow ten concurrent dispatches, your real throughput ceiling is five tasks per second regardless of what the dispatch rate is set to.
Here is a practical configuration sequence for a rate-limited API integration using a task queue:
- Measure the average duration of your API handler under realistic load.
- Identify the API provider's rate limit in requests per second.
- Set
max-dispatches-per-secondto match or slightly undercut the provider limit. - Calculate the concurrency needed:
max-concurrent-dispatches = rate × average duration. - Add 20 per cent headroom to account for variance in task duration.
- Configure exponential backoff with jitter for tasks that receive a
429response. - Set a maximum retry count and a dead-letter queue for tasks that exhaust retries.
| Configuration parameter | Purpose | Typical starting value |
|---|---|---|
max-dispatches-per-second | Controls request rate to the API | Match API rate limit |
max-concurrent-dispatches | Controls parallel handler load | Rate × avg task duration |
| Max retry attempts | Prevents infinite retry loops | 5 to 10 |
| Backoff multiplier | Spaces out retries under load | 2× with jitter |
Pro Tip: Concurrency is almost always the bottleneck for tasks that call slow third-party APIs. Set it conservatively at first and increase it only after measuring actual handler latency under load.
Caching, compression, and conditional requests
Reducing the number of API calls is only half the picture. Reducing the cost of each call matters just as much. Two techniques deliver outsized gains here: payload compression and HTTP caching.
On compression, the numbers are hard to argue with. Enabling gzip or Brotli on JSON payloads typically reduces their size by 70 to 90 per cent. Brotli achieves slightly better compression ratios than gzip for most text-based payloads. The CPU overhead of decompression is negligible on modern hardware. If your API client and server both support it and you are not using it yet, you are paying for bandwidth you do not need to pay for.
HTTP caching is more nuanced but equally powerful. The two mechanisms to understand are ETag headers and Cache-Control directives.
ETag: The server returns a unique token representing the current version of a resource. On subsequent requests, the client sendsIf-None-Match: <etag>. If the resource has not changed, the server returns304 Not Modifiedwith no body, saving the full payload transfer.Cache-Control: public, max-age=N: Tells CDNs and shared caches they can serve the response for N seconds without contacting the origin. This is particularly effective for read-heavy APIs with data that changes infrequently.Last-ModifiedandIf-Modified-Since: An older but still valid alternative to ETags for time-based cache validation.
Conditional GET requests returning 304 are one of the most underused tools for reducing API latency in cloud services. The catch is that caching breaks silently. Cache failures occur when ETags change unpredictably or when intermediate proxies strip conditional headers. Validate your caching implementation by running three test scenarios: a standard GET, a conditional GET that should return 304, and a GET after the resource has changed that should return the full 200 response.
| Technique | Bandwidth saving | Implementation effort | Best for |
|---|---|---|---|
| gzip compression | 70 to 90% | Low | All JSON APIs |
| Brotli compression | Slightly better than gzip | Low to medium | Modern clients |
| ETag conditional GET | Up to 100% of payload | Medium | Frequently polled resources |
Cache-Control with CDN | High for cacheable data | Medium | Public, read-heavy APIs |
Batching, bulk endpoints, and efficient pagination
Every API call carries overhead: TLS handshake, HTTP framing, authentication, and server-side processing. When your application makes hundreds of small calls to achieve what a single bulk request could accomplish, you are paying that overhead hundreds of times.
The first step is identifying which of your API calls are batchable. Look for patterns where your code calls the same endpoint in a loop, or where you fetch individual records one at a time when a list endpoint exists. Many cloud APIs offer explicit batch endpoints. The Google Gemini batch API, for example, processes large volumes at discounted rates with turnaround targets of up to 24 hours. If your workload can tolerate that latency, the cost reduction is substantial.
Practical steps for identifying and implementing batching:
- Audit your API call logs for repeated calls to the same endpoint within short time windows.
- Check the API provider's documentation for batch or bulk endpoints you may not be using.
- Group requests by entity type and send them as a single batch call wherever the API supports it.
- For write operations, confirm that the batch endpoint is atomic or that you can handle partial failures gracefully.
Pagination is a related area where inefficiency compounds quickly at scale. Offset-based pagination (?page=3&limit=100) requires the database to scan and discard all preceding rows on every request. At large offsets, this becomes expensive. Cursor-based pagination uses an indexed column as a pointer to the next page, avoiding the scan entirely. If you are consuming a cloud API that supports cursor pagination, use it. If you are building one, design for cursors from the start. Return next_cursor and has_more in your response metadata so clients can paginate without constructing fragile offset arithmetic.
The broader principle here is that your API client should prefer bulk operations as the default, not as an afterthought. Design your data-fetching layer to accumulate requests over a short window and dispatch them together, rather than firing each request the moment it is needed. This pattern, sometimes called request coalescing, is particularly effective in services that handle many concurrent user requests touching overlapping data.
Monitoring and analysing API usage
Optimisation without measurement is guesswork. Once you have implemented rate limiting, caching, and batching, you need to verify that they are working and identify what to fix next.
Start by tracking the signals your API provider already gives you:
- Monitor
X-RateLimit-RemainingandX-RateLimit-Resetheaders on every response. Log them. Alert when remaining capacity drops below 20 per cent. - Track your
429response rate over time. A spike indicates that your rate limiter is not keeping up with traffic growth. - Measure cache hit rates by counting
304responses as a proportion of total GET requests. - Log payload sizes for both requests and responses. An unexpected increase often signals a schema change or a missing compression header.
- Record end-to-end latency per endpoint. Segment by response code so that slow
429retries do not inflate your success-path latency figures.
Cloud providers offer tooling to support this. Google Cloud's App Optimize API supports scheduled exports of CPU and memory utilisation alongside cost reports, giving you a combined view of performance and spend. Use this data to correlate API call volume with cost line items. You will often find that a small number of endpoints account for a disproportionate share of both calls and cost.
Pro Tip: Set up anomaly detection alerts on your API call volume, not just your error rate. A sudden doubling of call volume at 3am is a cost problem even if the error rate stays at zero.
The goal is a feedback loop: measure, change one thing, measure again. Teams that treat API optimisation as a one-time project tend to regress. Teams that build monitoring into their deployment pipeline catch regressions before they appear on the cloud bill.
My honest take on API optimisation
I've worked with enough engineering teams to know that the most common mistake is not a missing technique. It is implementing retry logic without thinking about what happens when every instance retries simultaneously. Naive retry logic does not just fail to fix the problem. It amplifies it. I've seen a 429 storm take down adjacent services that had nothing to do with the rate-limited endpoint, simply because the retry load overwhelmed a shared connection pool.
The fix is centralisation. Handle retries at the queue boundary, not inside each service. One retry policy, enforced in one place, with a hard budget. Everything else should fail fast and let the queue handle the backpressure.
The other thing I'd push back on is the assumption that batching is always better. Batching trades latency for throughput and cost. If your users are waiting for a synchronous response, batching them into a 24-hour job is not an optimisation. It is a broken product. Choosing between synchronous and asynchronous modes is a workload decision, not a performance decision. Get that decision right before you start tuning parameters.
Caching is where I see the most silent failures. Teams implement ETags, declare victory, and never validate that the 304 responses are actually being served. Test it. Instrument it. The bandwidth savings are real, but only if the implementation is correct.
How Koritsu can help you cut API-related cloud costs

API inefficiency rarely shows up as a single line item on your cloud bill. It hides in Lambda invocation counts, data transfer charges, and overprovisioned task queues. Koritsu's AI platform, Kori, continuously analyses your cloud spending and surfaces exactly these kinds of buried inefficiencies. Teams working with Koritsu have achieved results like a 96% reduction in Lambda costs by fixing API-driven invocation patterns, and a 52% reduction in overall cloud spend through systematic infrastructure and API call optimisation. If you want to see where your API calls are costing you more than they should, start a free assessment. Koritsu only charges when savings are found.
Start with a free assessmentFAQ
What causes high API latency in cloud services?
High API latency is most commonly caused by uncompressed payloads, missing caching headers, and synchronous retry loops that add wait time to every failed request. Addressing compression and caching alone can reduce latency significantly.
How do I handle 429 rate limit errors correctly?
Read the Retry-After header and wait the specified duration before retrying. Add random jitter to prevent retry storms, and set a hard maximum retry count to avoid indefinite loops.
When should I use cursor-based pagination instead of offset pagination?
Use cursor-based pagination whenever your dataset is large or growing. Offset pagination requires the database to scan all preceding rows, which becomes costly at scale. Cursor pagination uses an indexed pointer and avoids that scan entirely.
Does batching always reduce cloud API costs?
Batching reduces per-request overhead and often qualifies for discounted pricing, but it introduces latency. It is only appropriate for workloads that can tolerate delayed processing. Synchronous, user-facing requests should not be batched into long-running jobs.
How do I validate that my HTTP caching is actually working?
Run three test requests: a standard GET, a conditional GET with the ETag that should return 304, and a GET after the resource has changed that should return a full 200. If any of these behave unexpectedly, check whether intermediate proxies are stripping your conditional headers.