FinOps Inform
Stop 1 GB per LCU surprises, cut load balancer costs for UK engineers
A UK-friendly, engineering runbook to diagnose which LCU drives your bill, cut processed bytes and inter AZ transfer waste, and verify savings against the bill.

To cut ALB or NLB costs fast, start by identifying which billing dimension is actually driving your charges, then eliminate unnecessary inter-AZ legs and reduce processed bytes before you touch anything else. Reserve capacity only once usage is stable. The sections below give you a diagnostic runbook, concrete fixes and a way to measure what you've actually saved.
TL;DR:
- The main cost driver for ALBs is the maximum of dimensions like processed bytes or connection counts, not the sum of all usage metrics.
- Inter-AZ data transfer costs can significantly increase expenses, especially with uneven target distribution or default cross-zone load balancing enabled.
- Diagnosing cost drivers requires measuring LCU metrics, cross-reference with billing data, and testing configuration changes during low-traffic periods.
- Low-effort fixes such as enabling compression, connection reuse, and internal load balancer use can yield quick savings, while topology changes need careful planning.
- Reservations for LCUs are effective only if workload stability is verified over time and not for highly variable or spiky traffic patterns.
ALB, NLB and CLB pricing mechanics and LCU math
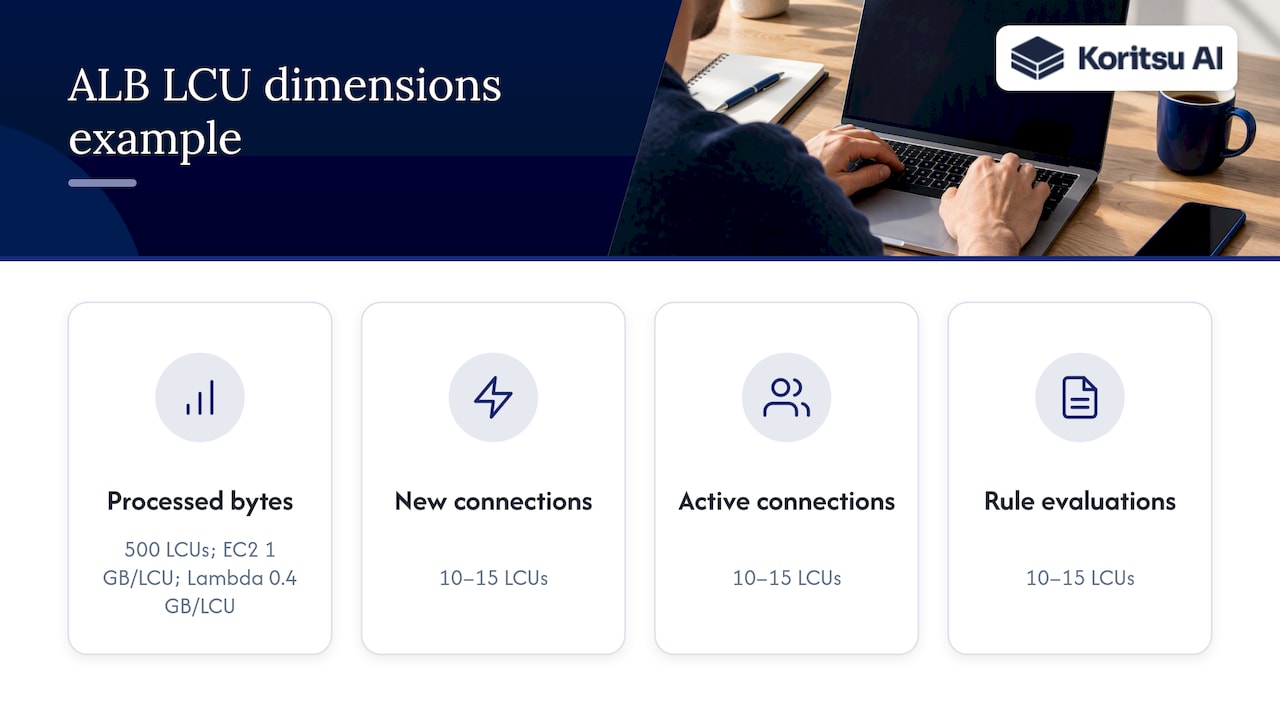
Every AWS load balancer charges an hourly base fee plus usage-based charges, and the usage-based part is where most bills get out of hand. For Application Load Balancers, AWS bills you for Load Balancer Capacity Units, or LCUs, measured across four dimensions: new connections per second, active connections per minute, processed bytes and rule evaluations. Here's the part engineers miss: AWS bills the maximum of these four dimensions for each hour, not the sum. If your processed-bytes dimension needs 40 LCUs but your connection count only needs 5, you pay for 40.
Network Load Balancers use a parallel but distinct unit, NLCUs, based on different dimensions (new connections, active connections, processed bytes and, for TLS, connections). Classic Load Balancers bill per-GB processed rather than through a capacity-unit model, which makes them simpler to reason about but harder to optimise granularly.
Target type matters more than most teams realise. As of 2026, each LCU provides 1 GB of processed bytes per hour for EC2 targets, but only 0.4 GB for Lambda targets. A workload that looks cheap on EC2 can consume far more LCUs once it moves behind Lambda targets, simply because the processed-bytes allowance shrinks.
Here's a worked example: say a service pushes 500 GB of processed bytes through an ALB with EC2 targets in a given hour. At 1 GB per LCU, that's 500 LCUs from the processed-bytes dimension alone. If the same service only generates 50 new connections per second and modest rule evaluations, those dimensions might need just 10 to 15 LCUs. The bill is set by the 500, not the 15. This is why a diagnostic-first approach beats blanket optimisation: tackling connection churn or rule complexity does nothing if processed bytes is the dimension actually driving your invoice.
How data transfer charges layer on top of load balancer fees
Load balancer fees are only half the picture. Data transfer charges stack on top, and they're where a lot of unexplained spend hides. Inter-AZ data transfer, in particular, catches teams off guard because a single request can cross AZ boundaries more than once.
Inter-AZ data transfer within the same Region is billed at roughly $0.01/GB per direction between load balancers and EC2 instances, and a request that hops from client to load balancer in AZ-A, then to a target in AZ-B, then back, can rack up multiple billed legs for what looks like one transaction. When your targets are spread unevenly across availability zones and cross-zone load balancing is enabled by default, this happens constantly without anyone noticing.
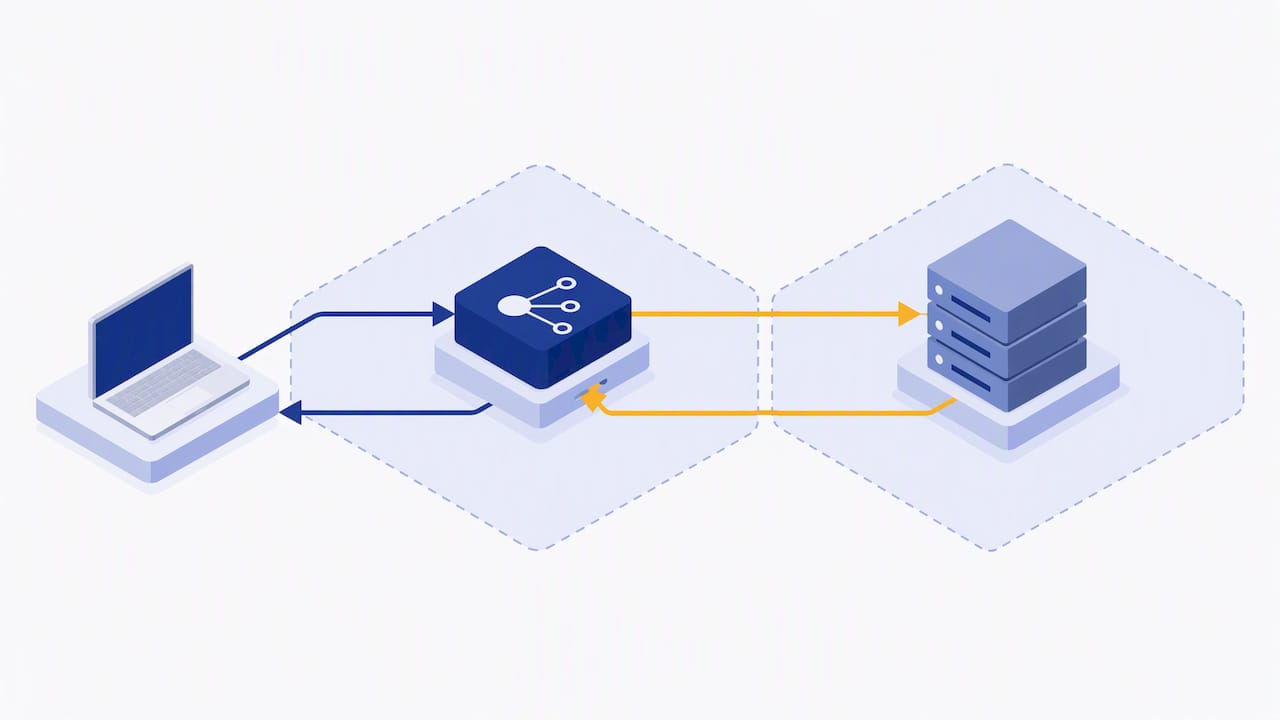
Public versus internal load balancers behave differently too. An internet-facing load balancer routes traffic through an Internet Gateway, and traffic that unnecessarily loops back out through the IGW, rather than staying on private IPs within the VPC, picks up extra data transfer charges. Internal load balancers using private addressing avoid that loop entirely, which is why service-to-service traffic should rarely go through a public-facing LB in the first place.
NAT gateways add another layer. They carry both a per-hour charge and a per-GB processing charge, and running one per AZ, which AWS recommends for resilience, multiplies the hourly cost even before you count the data processed. Routing traffic that could stay internal through a NAT gateway, rather than a VPC endpoint, is a common and avoidable expense. Cross-region egress compounds all of this further: any architecture that routes load balancer traffic across regions should be treated as a deliberate, costed decision, not a default.
Diagnose your dominant cost driver before you change anything
Before touching configuration, spend a day collecting the right data. Guessing which dimension dominates your bill wastes engineering time on fixes that don't move the needle.
- Pull ConsumedLCUs and PeakLCUs from CloudWatch load balancer metrics broken down by dimension, since LCU billing takes the maximum of the four, not the sum.
- Cross-reference against LoadBalancerUsage and DataProcessing-Bytes in your Cost and Usage Reports to see which billing code actually moves with your spend.
- Run a short in-AZ synthetic client test to isolate whether cross-zone traffic is inflating your data transfer line.
- Toggle response compression for an hour on a non-critical path and compare processed bytes before and after.
- Briefly disable cross-zone load balancing on a low-risk listener to see the immediate effect on inter-AZ charges, then re-enable if targets aren't balanced per AZ.
Watch for noise that disguises the real driver: retry storms from an upstream service, health-check frequency set too aggressively, and bot or scanner traffic hitting public endpoints can all inflate connection counts without reflecting genuine demand.
Pro Tip: Run your diagnostic tests in a low-traffic window first. A test that looks clean at 2am can behave very differently once peak load and retry behaviour kick in.
Concrete optimisation tactics, ranked by expected ROI and effort
Once you know your dominant driver, work through fixes in order of effort versus payoff. Don't start with topology changes if a five-minute configuration tweak gets you most of the saving.
Low effort, high impact:
- Enable response compression on your application or load balancer layer to cut processed bytes directly, which matters most when that dimension drives your bill.
- Consolidate chatty API calls into fewer, larger requests rather than many small ones, reducing new-connection and rule-evaluation pressure.
- Turn on HTTP keep-alive and connection reuse so clients and targets aren't repeatedly paying the connection-setup cost.
- Tighten retry logic and add rate limiting at the edge so a downstream failure doesn't multiply your request volume.
Topology changes take more planning but can remove entire categories of charge. Enabling 100% zonal affinity, paired with proportional target capacity per AZ, can eliminate inter-AZ data transfer charges because traffic never needs to cross a zone boundary. The catch is that disabling cross-zone load balancing requires you to maintain a matching number and capacity of targets in each AZ; get that balance wrong and one AZ gets overloaded while another sits idle. For purely internal service calls, swap the public load balancer for an internal one and keep the traffic off the Internet Gateway entirely.
For network-level alternatives, CloudFront can absorb a large share of static and cacheable traffic before it ever reaches your load balancer, and Global Accelerator can help route traffic efficiently for latency-sensitive, multi-region setups. Offloading heavy static payloads to a CDN often reduces processed bytes on the ALB more effectively than any application tuning.
A few traps catch teams repeatedly: health checks set to run every few seconds across hundreds of targets add up in connection volume, complex rule chains add unnecessary rule-evaluation LCUs, and internal service-to-service calls that were never meant to be public but got wired through an internet-facing load balancer anyway. Each of these is cheap to fix once you've spotted it, but invisible until you look.
Pro Tip: When you disable cross-zone load balancing, add a CloudWatch alarm on per-target request count so you catch an imbalance within minutes, not after a support ticket.
Reserved LCUs and capacity planning
Reserved capacity makes sense for predictable, stable workloads, and a poor fit for anything that spikes or trends. AWS lets you reserve LCU capacity ahead of time, billed hourly regardless of whether you use it, in exchange for a lower effective rate than on-demand consumption.
ReservedLCUs are reported on a per-minute basis, which gives you a precise way to check whether a reservation is paying off. Compare ReservedLCUs against PeakLCUs over at least a couple of weeks of representative traffic. Below that, you're paying for headroom you don't use.
Reservations only cover the LCU dimension itself. They do nothing for inter-AZ transfer, NAT gateway charges or IGW egress, so a reservation decision should sit downstream of the diagnostic and topology work, not ahead of it. Set CloudWatch alarms on both metrics so a traffic shift doesn't leave you over-reserved for months before anyone notices.
Monitoring, billing codes and reconciling changes with the bill
Measuring the actual dollar effect of a change means connecting CloudWatch to your Cost and Usage Reports, not just trusting that a fix should work.
- Watch for LoadBalancerUsage (hourly base charge), LCUUsage (capacity-unit consumption), DataProcessing-Bytes (per-GB transfer), ReservedLCUUsage and IdleProvisionedLBCapacity in your billing and usage reports, since these are the exact line items tied to your invoice.
- Capture a baseline covering at least a week of normal traffic before applying any change.
- Apply one change at a time, such as toggling compression, and let it run for a comparable period.
- Compare the same hours and days of week across both periods in both CloudWatch metrics and CUR billing rows, since traffic patterns rarely stay flat.
A short, single-variable test like this against your actual billing rows is the fastest way to confirm a fix is real rather than coincidental.
Prioritised action checklist and worked savings examples
Treat this as a sprint, not a project. Capture metrics first, identify the dominant driver, apply the cheapest fixes, measure against the bill, then decide whether reservations or outside help make sense.
You'd expect the processed-bytes-driven portion of your LCU consumption to fall by roughly the same 30%, which you then confirm against the actual DataProcessing-Bytes line in your CUR, not just the CloudWatch metric.
Worked example B: say a service with balanced targets across two AZs removes one unnecessary inter-AZ leg per request by enabling zonal affinity. At $0.01/GB per direction, a service moving 2,000 GB per month that previously crossed AZs on every request could remove roughly $20 of transfer charge for that 2,000 GB, before accounting for any remaining necessary cross-AZ flows.
| Action | Typical effort | Primary saving source |
|---|---|---|
| Enable compression | Low | Processed bytes (LCU) |
| Connection reuse and keep-alive | Low | New/active connection LCUs |
| Enable zonal affinity | Medium | Inter-AZ data transfer |
| Move internal calls to internal LB | Medium | IGW egress |
| Reserve LCU capacity | Low, after measurement | Hourly LCU rate |
Scope each action against engineer-days required versus the monthly saving it's likely to produce, and sequence the cheap, low-risk fixes before anything that touches production topology.
Koritsu's approach and practitioner proof points
We built our platform around the same diagnostic-first logic laid out above, because guessing at fixes wastes engineering time whether you're doing it manually or paying someone else to do it manually. An AI agent can run continuous analysis across your cloud spend and surface exactly which dimension, which service and which AZ is driving cost, rather than handing you a generic dashboard.
Start by measuring the same things this article covers: which LCU dimension dominates, how much inter-AZ traffic exists, whether NAT gateways are absorbing traffic that could use VPC endpoints, and how costs break down by team or service rather than by account total. Specialists can then work alongside your engineers to implement the fixes, not just report them.
When higher cost is the right call
Cost optimisation is not the goal. Cost that matches the value you're getting is the goal, and sometimes cross-zone routing or multi-AZ redundancy earns its keep because the availability it buys matters more than the data transfer line it adds. Regulatory requirements or hard uptime commitments can justify leaving that spend in place.
Where you do optimise, do it gradually: canary the change on one service, watch per-AZ capacity and error rates, then widen the rollout once you trust the numbers. Any change to cross-zone or topology settings in production should go through the same review your team already uses for infrastructure changes, with the reasoning and expected saving written down so the next engineer understands why the configuration looks the way it does.
Find the savings you can't see from a dashboard
Most of the fixes above are things your own team can implement once you know where to look, and that's precisely the problem: finding the dominant driver across every service, AZ and NAT gateway in a real production estate takes time most engineering teams don't have spare. You can find out through a free assessment, with payment only on a share of the savings verified against your bill, so there's no upfront cost to see what's there.

From a Savings Opportunity Report that shows exactly where your load balancer and data transfer spend is going, through to FinOps as a Service plans like Monitor and Advisor for ongoing coverage, we scope the engagement to what you need. If retry storms or batching inefficiencies are part of what's driving your connection counts, patterns covered well in guides on batch email sending and safe retry strategies, our review catches those alongside the infrastructure-level issues. Check our pricing page to see how the success fee works, and get in touch to start with the free assessment.
FAQ
What is an elastic load balancer?
An elastic load balancer is an AWS service that distributes incoming application traffic across multiple targets, such as EC2 instances or Lambda functions, in one or more availability zones. It comes in three types, Application, Network and Classic, each with its own pricing model based on usage dimensions like LCUs or per-GB processed data.
What is cost optimization?
Cost optimisation is the ongoing process of reducing cloud spend without reducing the performance or reliability your workload needs. For load balancers specifically, it means identifying which billing dimension drives your charges and addressing that dimension directly, rather than cutting spend indiscriminately.
Which AWS service can provide recommendations for cost optimization?
AWS Cost Explorer and the Cost and Usage Reports give you the raw billing data needed to spot load balancer cost drivers, while CloudWatch metrics show the underlying usage behind them. We combine this kind of data with hands-on engineering review to turn those numbers into specific, implementable fixes.
How much do AWS Load Balancers cost?
AWS Load Balancers charge an hourly base fee plus usage-based charges measured in Load Balancer Capacity Units, with billing based on the maximum of several dimensions consumed in a given hour, not their sum. The exact monthly cost depends heavily on your traffic pattern, with processed bytes, connection count and data transfer all contributing differently depending on your architecture.