FinOps Inform · Cost Optimisation
Cloud performance engineering explained for architects
Discover how cloud performance engineering explained can optimize your cloud systems, reduce costs, and enhance user satisfaction. Learn more today!

Cloud performance engineering is the discipline of designing, measuring, and optimising cloud systems to meet explicit user-facing performance targets, defined through Service Level Indicators (SLIs), Service Level Objectives (SLOs), and latency budgets. Most teams running workloads on AWS, Google Cloud, or Azure treat performance as an afterthought, only investigating when users complain. That approach is expensive and reactive. The practice of cloud performance engineering explained properly covers everything from how you instrument your services with OpenTelemetry to how you allocate latency across service layers and validate fixes over full business cycles. Get this right and you reduce both user-visible failures and the wasted compute spend that comes with poorly tuned infrastructure.
How are latency budgets and percentiles used to manage performance targets?
Latency is not a single number. It is a distribution, and the shape of that distribution tells you far more than any average ever could. Percentile-based metrics like P50, P95, and P99 give you a structured view of user experience across the full range of requests. P50 is the median, P95 covers the experience of most users, and P99 focuses on the tail latency that directly drives your SLO targets.
Tail latency matters because it is the experience of your worst-affected users. A system with a P50 of 40ms can still have a P99 of 800ms, and that 800ms is what drives negative reviews, abandoned checkouts, and SLA breaches. Averages hide this completely.
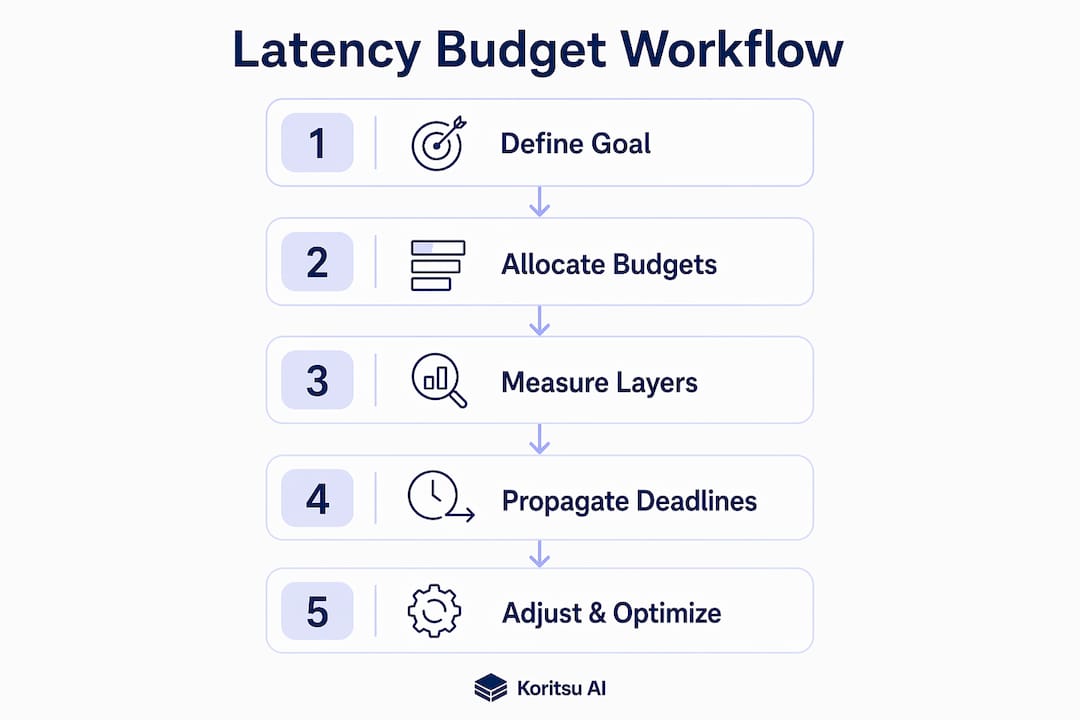
Latency budgets take this further by allocating allowable latency across each layer of your architecture. A typical allocation might look like this:
- Edge and CDN: 10ms
- API gateway: 15ms
- Authentication service: 20ms
- Cache layer: 5ms
- Application service: 30ms
- Database query: 40ms
Each layer receives an absolute deadline. Those deadlines propagate end-to-end, so every service knows its budget and can enforce it. Without this propagation, teams tune individual services in isolation and never understand why the overall request latency remains high.
One critical pitfall is coordinated omission. Standard load testing tools often fail to record latency for requests that were queued rather than actively processed. This produces artificially optimistic percentile results. Proper percentile calculation requires production-like histogram semantics that account for queuing time, not just processing time.
Pro Tip: Measure P50, P95, P99, and P99.9 separately for every service tier. P99.9 in particular exposes the outliers that cascade into downstream timeouts and are invisible at P99.
What role does observability play in diagnosing cloud performance?
Observability is the foundation of cloud performance optimisation. Without it, you are guessing. Observability signals fall into three categories, each serving a distinct diagnostic purpose:
- Metrics show the health and throughput of your system over time. CPU utilisation, request rate, and error rate are examples. They tell you that something is wrong.
- Traces follow a single request as it travels through your distributed services. They tell you where the latency is accumulating.
- Logs provide the granular, timestamped detail that tells you why a specific failure occurred.
These three signals work together. Metrics surface an anomaly, traces localise it to a specific service or database call, and logs provide the root cause. Treating them as separate concerns is one of the most common mistakes in cloud engineering. Correlating all three telemetry pillars is what separates a 10-minute diagnosis from a 10-hour one.
OpenTelemetry is the de facto standard for instrumentation. It provides vendor-neutral APIs and SDKs for generating metrics, logs, and traces across services written in Python, Java, Go, and other languages. You can export telemetry to backends like Grafana, Datadog, or Honeycomb without rewriting your instrumentation when you switch tools.

Observability also connects directly to your SLO monitoring. SLIs measure user-facing behaviour, SLOs set the explicit target such as 99.9% of requests completing under 200ms, and error budgets represent the allowable failure proportion. When your error budget is depleting faster than expected, your observability stack should surface that signal before users notice.
Pro Tip: Partial observability is worse than no observability. If you instrument your application tier but not your database or cache, you will consistently misattribute bottlenecks and waste engineering time on the wrong layer.
Which performance testing strategies reflect real cloud behaviour?
Performance testing in the cloud is not the same as performance testing on a local server. Cloud-specific factors like noisy neighbours, network variability, autoscaling delays, and cold starts introduce latency patterns that simply do not appear in development environments. Testing on infrastructure that does not resemble production produces results that do not reflect production behaviour.
The four test types every cloud engineering team should run are:
- Load tests confirm the system meets performance targets under expected traffic volumes.
- Stress tests identify the breaking point by pushing traffic beyond normal operating levels.
- Soak tests run sustained load over hours or days to detect memory leaks, connection pool exhaustion, and gradual degradation.
- Scalability tests verify that autoscaling policies trigger correctly and that performance holds as the system scales out.
Report all results using percentile metrics, not averages. A load test that reports “average response time 120ms” tells you almost nothing. The same test reporting P95 at 340ms and P99 at 1,200ms tells you there is a tail latency problem that will affect a meaningful proportion of your users under real traffic.
Continuous testing is the practice that ties this together. Rather than running performance tests before a release and forgetting about them, you integrate them into your CI/CD pipeline. This feeds directly into capacity planning. Long-term trend analysis separates repeating seasonal patterns from genuine anomalies, and hybrid predictive models can reduce latency variability by over 60%. That kind of insight only comes from continuous, structured data collection over time.
For practical guidance on how infrastructure decisions affect your cost and performance trade-offs, the cloud deployment cost checklist is worth reviewing before you design your test environments.
What is the recommended workflow for resolving cloud performance issues?
A disciplined remediation workflow is what separates teams that fix performance problems from teams that chase them indefinitely. A structured multi-step approach prevents regressions and ensures fixes are validated against real targets rather than gut feel.
- Define SLA targets with percentile thresholds. Set explicit targets such as P99 latency under 500ms for 99.9% of requests over a rolling 30-day window. Vague targets produce vague fixes.
- Capture a performance baseline. Use your monitoring tools to record current P50, P95, and P99 values across all service tiers before touching anything. This is your reference point.
- Localise the bottleneck by service tier. Use distributed traces to identify which layer is consuming the most latency budget. Remote service dependencies amplify latency variation in cloud architectures because CPU frequently waits on I/O and network calls rather than doing compute work.
- Identify root cause using logs. Once traces point to a specific service or database, use structured logs to understand why. Slow queries, lock contention, and serialisation overhead are common culprits.
- Implement the fix with a rollback plan. Deploy changes incrementally using feature flags or canary deployments. Never deploy a performance fix without a defined rollback path.
- Validate over a full business cycle. A fix that looks good on a Tuesday afternoon may fail on a Monday morning peak. Validate performance against your SLO targets across at least one full weekly cycle before closing the issue.
Error budgets guide your risk tolerance throughout this process. Error budgets balance reliability against feature velocity, giving teams a data-driven framework for deciding how aggressively to push changes. If your error budget is nearly exhausted, you slow down. If it is healthy, you can move faster. For a concrete example of this workflow applied to a real bottleneck, the slow batch job case study walks through the full process from diagnosis to validation.
Key takeaways
Effective cloud performance engineering requires percentile-based measurement, end-to-end observability, and a structured remediation workflow to consistently meet user-facing SLOs.
| Point | Details |
|---|---|
| Use percentile metrics, not averages | P99 and P99.9 expose tail latency that averages hide and that directly drives SLO breaches. |
| Allocate latency budgets per layer | Assign absolute deadlines to each service tier and propagate them end-to-end to avoid misaligned tuning. |
| Instrument with all three signals | Metrics detect anomalies, traces localise them, and logs diagnose root cause. Use all three together. |
| Test continuously on production-like infra | Cloud-specific factors like cold starts and autoscaling lag only appear in realistic test environments. |
| Validate fixes over a full business cycle | A fix that holds on a quiet afternoon may fail under peak load. Validate across at least one weekly cycle. |
Where most teams go wrong with cloud performance
I have seen the same mistake repeated across dozens of cloud environments. Teams instrument their application tier, set up a dashboard in Grafana, and declare their observability “done.” Then a P99 spike appears and they spend two days looking in the wrong place because their database layer has no tracing and their cache hit rate is invisible.
Average latency measurements are the other persistent problem. A team will spend three weeks optimising a service that looks slow on their dashboard, only to discover the average was being dragged up by a handful of outlier requests tied to a misconfigured timeout. P99 would have shown them the real shape of the problem in minutes.
End-to-end deadline propagation is the concept I find most consistently overlooked. You can tune every individual service to meet its local latency target and still miss your overall SLO because nobody modelled how those budgets interact under concurrent load. The latency budget allocation approach forces that conversation to happen before you deploy, not after users complain.
Continuous testing is not a luxury for large teams. Even a small engineering team can integrate a basic load test into their CI/CD pipeline in a day. The discipline of running that test on every significant deployment catches regressions before they reach production. One-off performance evaluations before a major release give you a false sense of security.
Finally, SLOs and error budgets are not just reliability tools. They are the mechanism that aligns engineering priorities with business outcomes. When your error budget is healthy, you have evidence to support moving faster. When it is depleted, you have evidence to push back on feature work. That is a far better conversation to have than arguing about whether a system “feels slow.”
— Kori
How Koritsu AI helps you act on performance findings
Understanding cloud performance engineering is the first step. Acting on it efficiently is where most teams lose time and money. Koritsu AI combines an AI platform that continuously analyses your cloud spending with hands-on expert advice to find the inefficiencies buried in how your software and infrastructure were built. The results are measurable. A UK bidding platform worked with Koritsu AI and achieved a 52% reduction in cloud costs by addressing the structural inefficiencies that performance engineering surfaces. If you want to understand where your own cloud spend is leaking, start your free assessment today. You only pay when savings are found.
Start with a free assessmentFAQ
What is cloud performance engineering?
Cloud performance engineering is the practice of designing and optimising cloud systems to meet explicit user-facing performance targets using SLIs, SLOs, latency budgets, and observability. It covers measurement, testing, and structured remediation workflows.
Why use P99 instead of average latency?
P99 captures tail latency that averages obscure. A system with a fast average can still deliver a poor experience to 1 in 100 users, and those users are the ones most likely to churn or raise support tickets.
What is a latency budget in cloud systems?
A latency budget allocates the total allowable request latency across each service layer, from edge to database. Each layer receives an absolute deadline, and those deadlines propagate end-to-end to keep the overall request within its SLO target.
How does OpenTelemetry support cloud performance optimisation?
OpenTelemetry provides vendor-neutral instrumentation APIs for generating metrics, logs, and traces across distributed services. It allows teams to export telemetry to any compatible backend without rewriting instrumentation when tooling changes.
What is an error budget and why does it matter?
An error budget represents the allowable failure proportion within an SLO, for example 0.1% of requests for a 99.9% SLO. It gives engineering teams a data-driven way to balance reliability work against feature delivery without resorting to subjective arguments.