FinOps Inform
The FinOps metrics every engineering leader should track
Discover the essential FinOps metrics engineering leaders must track to ensure effective cloud financial governance and maximize value.

The five FinOps metrics that matter most right now are: cost allocation rate, effective savings rate (ESR), commitment coverage and utilisation, resource utilisation rate, and unit economics (cost per unit of value). Add forecast accuracy and, where AI or GPU workloads are present, GPU utilisation and cost per inference. These seven cover the ground between “where is the money going?” and “is it producing value?”, which is the full span of cloud financial governance.
Here is the short-form priority list, with the primary data source for each:
- Cost allocation rate — the percentage of cloud spend attributed to a team, service, or product. Source: billing export + tagging inventory. Low allocation means every downstream KPI is unreliable.
- Effective savings rate (ESR) — amortised spend divided by equivalent on-demand spend, expressed as a percentage saved. Source: billing export with amortised cost columns. The FinOps Foundation’s KPI library identifies this as the most honest single metric for rate optimisation.
- Commitment coverage — the share of eligible spend covered by Reserved Instances, Savings Plans, or committed-use discounts. Source: billing export, commitment reports.
- Resource utilisation rate — actual consumption as a percentage of provisioned capacity, per service or workload. Source: cloud monitoring (CloudWatch, Azure Monitor, Cloud Monitoring) joined to billing. Billing data alone cannot measure this.
- Unit economics / cost per unit of value — cloud cost divided by a business output (cost per transaction, per active user, per API call). Source: billing + product analytics joined. This is the last metric most teams implement because it requires data outside the billing export.
- Forecast accuracy — variance between predicted and actual spend, expressed as a percentage. Source: billing export + forecasting tool.
- AI/GPU cost metrics — GPU utilisation rate and cost per inference (or per 1,000 tokens) for teams running AI workloads. Source: GPU monitoring + billing export.
Billing data alone is insufficient for usage and unit economics. You need monitoring, tagging, and product analytics joined to cost data before those KPIs are trustworthy. The TechTarget FinOps KPI guide recommends starting with resource utilisation, cloud waste percentage, cost allocation rate, unit cost, discount coverage, and spend variance as the essential six.
Key takeaways
Effective FinOps metrics require reliable data, named owners, and a reporting cadence matched to the audience. Without all three, even the right KPIs produce no change.
| Point | Details |
|---|---|
| Start with allocation | Cost allocation rate must exceed 80% before any per-team or per-service KPI is trustworthy. |
| ESR is the rate optimisation anchor | Effective savings rate compares amortised to on-demand cost and avoids the misleading optics of commitment coverage alone. |
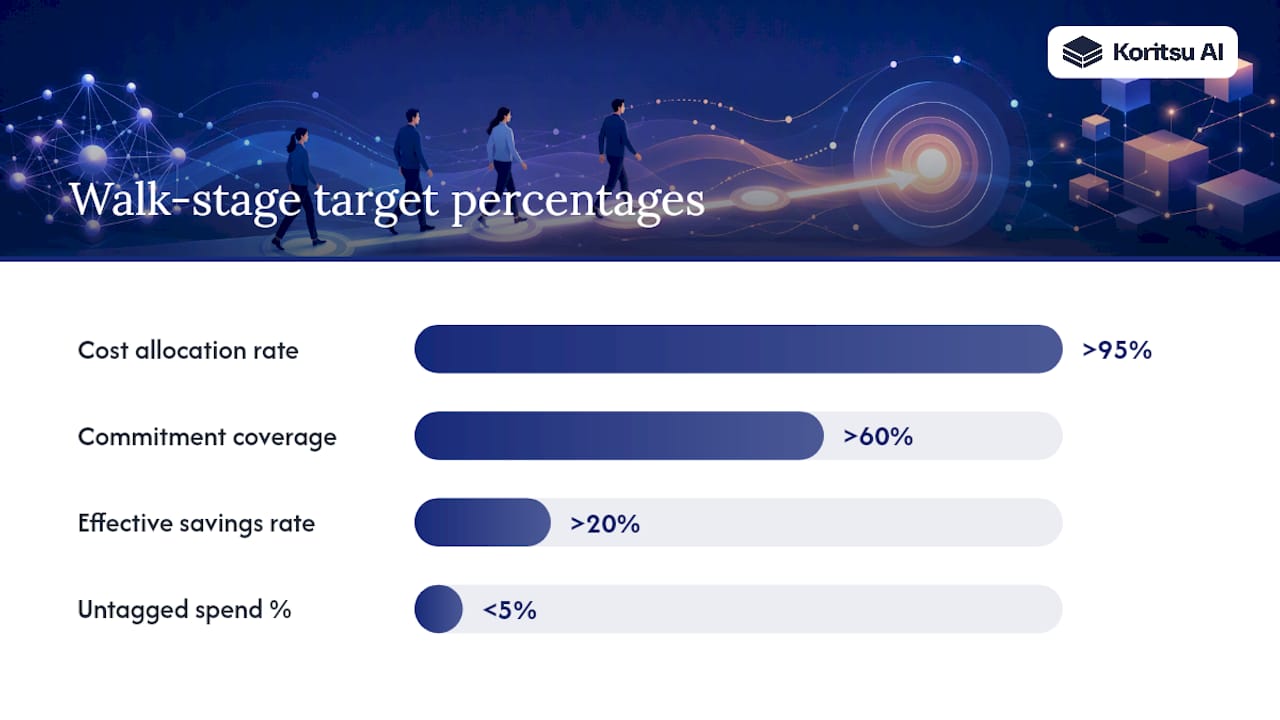
| Match KPIs to maturity stage | Crawl teams track allocation and spend visibility; Walk teams add ESR, utilisation, and waste; Run teams add unit economics and automated anomaly detection. |
| Billing data is not enough | Resource utilisation, Kubernetes metrics, and unit economics all require monitoring and product analytics joined to billing exports. |
| Koritsu AI delivers verified savings | Koritsu AI’s success-fee model means clients pay only for savings confirmed against billing exports, not for recommendations. |
How to group FinOps KPIs: four categories and who owns them
Every FinOps KPI answers one of four questions. Grouping metrics by the question they answer makes it far easier to assign ownership, route findings to the right decision-maker, and avoid the common failure of tracking twenty metrics that nobody acts on.
The four functional categories:
- Visibility and allocation — Where is the money going? Covers cost allocation rate, untagged spend percentage, and shared cost attribution. Owned primarily by the FinOps team, with engineering leads accountable for tag compliance within their services.
- Rate optimisation — Are we paying the right price? Covers ESR, commitment coverage, commitment utilisation, and discount coverage. Owned jointly by FinOps and finance, with engineering input on workload stability.
- Usage and utilisation optimisation — Are we using what we pay for? Covers resource utilisation rate, idle/unused resource percentage, and waste rate. Owned by engineering leads, with FinOps providing the measurement framework and anomaly detection.
- Business alignment and unit economics — Is spend producing value? Covers cost per unit of value, cost per feature, and AI cost per inference. Owned by product and leadership, with FinOps and engineering providing the data pipeline.
The category framework also maps directly to the FinOps RACI. FinOps practitioners are typically responsible for measurement and reporting across all four categories. Finance approves targets and budget thresholds. Engineering leads are accountable for usage and allocation within their domains. Product and senior leadership consume business alignment metrics to make investment decisions.
| Category | Core question | Common KPIs | Primary data sources | Typical owner |
|---|---|---|---|---|
| Visibility and allocation | Where does spend go? | Allocation rate, untagged %, shared cost % | Billing export, tag inventory | FinOps team |
| Rate optimisation | Are we paying the right price? | ESR, commitment coverage, commitment utilisation | Billing export, commitment reports | FinOps + Finance |
| Usage optimisation | Are we using what we pay for? | Utilisation rate, idle resource %, waste rate | Cloud monitoring, billing | Engineering leads |
| Business alignment | Is spend producing value? | Cost per unit, cost per inference | Billing + product analytics | Product + Leadership |
Detailed KPI reference: definitions, formulas, and recommended targets
The FinOps Foundation documents more than 30 KPIs, and some catalogues such as KPI Depot list up to 83 distinct metrics. You do not need all of them. The table below covers the core set that most UK FinOps and engineering teams should implement, with formulas, data sources, owners, and maturity-stage targets.
| KPI | Definition | Formula | Data sources | Owner | Target / maturity stage |
|---|---|---|---|---|---|
| Cost allocation rate | % of total cloud spend attributed to a team, service, or product | (Attributed spend / Total spend) × 100 | Billing export, tag inventory | FinOps team | >80% at Crawl; >95% at Walk |
| Untagged spend % | % of spend with no cost-allocation tag | (Untagged spend / Total spend) × 100 | Billing export, tag audit | FinOps team | <20% at Crawl; <5% at Walk |
| Shared cost % | % of spend in shared services not yet allocated to consumers | (Shared unallocated spend / Total spend) × 100 | Billing export, allocation model | FinOps + Finance | Tracked at Walk; <10% at Run |
| Effective savings rate (ESR) | % saved vs. equivalent on-demand pricing, accounting for amortised commitments | ((On-demand equivalent cost − Amortised cost) / On-demand equivalent cost) × 100 | Billing export (amortised columns) | FinOps + Finance | >20% at Walk |
| Commitment coverage | % of eligible spend covered by Reserved Instances, Savings Plans, or committed-use discounts | (Committed spend / Total eligible spend) × 100 | Billing export, commitment reports | FinOps + Finance | >60% at Walk; >80% at Run |
| Commitment utilisation | % of purchased commitment capacity actually consumed | (Consumed commitment / Purchased commitment) × 100 | Billing export, commitment reports | FinOps + Finance | >85% at Walk; >95% at Run |
| Resource utilisation rate | Actual consumption as % of provisioned capacity | (Actual usage / Provisioned capacity) × 100 | Cloud monitoring (CloudWatch / Azure Monitor / Cloud Monitoring) | Engineering leads | >60% CPU/memory at Walk |
| Idle/unused resource % | % of provisioned resources with near-zero consumption | (Idle resource count / Total resource count) × 100 | Cloud monitoring, billing | Engineering leads | <10% at Walk; <5% at Run |
| Waste rate | % of spend on resources delivering no measurable business value | (Waste spend / Total spend) × 100 | Billing + monitoring + tag data | FinOps + Engineering | <15% at Walk |
| Forecast accuracy | Variance between predicted and actual spend | ((Actual spend − Forecast spend) / Actual spend) × 100 | Billing export, forecasting tool | FinOps + Finance | Within ±10% at Walk; ±5% at Run |
| Cost per unit of value | Cloud cost per business output (transaction, user, API call) | Total cloud cost / Business output volume | Billing + product analytics | Product + FinOps | Trending down quarter-on-quarter |
| GPU utilisation rate | % of GPU capacity consumed by AI/ML workloads | (GPU hours used / GPU hours provisioned) × 100 | GPU monitoring, billing | Engineering + ML leads | >70% at Walk |
| Cost per inference | Cloud cost per model inference or per 1,000 tokens | Total AI compute cost / Inference count | Billing + inference logs | ML leads + FinOps | Trending down; benchmarked per model |
| Anomaly detection latency | Time from cost anomaly occurrence to alert | Time of alert − Time of anomaly onset | Anomaly detection tooling, billing | FinOps team | <24 hours at Walk; <4 hours at Run |
Example calculation — cost allocation rate: If £950,000 of a £1,000,000 monthly bill is tagged and attributed, your allocation rate is 95%. That is a solid Walk-stage result. The remaining £50,000 is invisible to per-team reporting.
Pro Tip: Three KPIs with named owners beat twenty unowned ones. Before adding a new metric, confirm who will receive the alert, who can act on it, and within what timeframe. If you cannot answer all three, the metric is not ready to track.
For teams running unit cost metrics, the cost-per-unit calculation requires joining billing data to product analytics, a pipeline that takes time to build but delivers the most commercially meaningful signal in the entire FinOps operating model.
Which KPIs should you adopt first at each maturity stage?
The FinOps maturity model describes Crawl, Walk, and Run as capability-level descriptors, not organisation-wide labels. A team can be at Run for commitment management and Crawl for unit economics simultaneously. That is normal, and it is the right way to think about metric adoption: implement KPIs at the maturity level where you can reliably collect the data and act on the result.
The guiding principle is fitness for purpose. Tracking cost per inference before you have a stable billing-to-monitoring join produces noise. The FinOpsForge maturity guide notes that Walk-stage typically delivers 70–80% of the financial benefit for most organisations, and that moving from Crawl to Walk commonly takes about one to two years. That timeline is realistic for UK teams building from scratch.
Stage 1: Crawl — establish visibility
- Enable billing exports and confirm data completeness (no gaps, correct granularity).
- Audit tag coverage; calculate untagged spend percentage.
- Track total cloud spend by provider and account.
- Measure cost allocation rate at the account or project level.
- Identify the top five cost drivers by service.
At Crawl, you are not yet optimising. You are building the data foundation that makes every subsequent metric trustworthy.
Stage 2: Walk — add rate and usage optimisation
- Implement ESR and commitment coverage tracking.
- Add commitment utilisation monitoring; set alerts for utilisation below 85%.
- Measure resource utilisation rate per service using cloud monitoring data.
- Track idle/unused resource percentage and waste rate.
- Introduce forecast accuracy tracking with a monthly cadence.
- Begin anomaly detection with a 24-hour latency target.
Stage 3: Run — add unit economics and automation
- Build the billing-to-product-analytics join for cost per unit of value.
- Implement GPU utilisation and cost per inference for AI workloads.
- Automate anomaly detection with sub-4-hour latency.
- Integrate FinOps metrics into CI/CD pipelines (cost gates on deployments).
- Report unit economics to product and leadership monthly.
The FinOps Framework assessment playbook recommends scoring each capability across Knowledge, Process, Metrics, Adoption, and Automation lenses, then weighting by business priority to identify where to focus next. That scoring approach prevents teams from over-engineering metrics in low-value capabilities while under-investing in high-impact ones.
| KPI | Crawl | Walk | Run |
|---|---|---|---|
| Cost allocation rate | Track at account level | Track at team/service level | Automated, real-time |
| Untagged spend % | Measure and report | Enforce via policy | Auto-remediated |
| ESR | Not yet | Track monthly | Track weekly, automated |
| Commitment coverage | Not yet | Track and optimise | Automated purchasing |
| Resource utilisation rate | Not yet | Track per service | Automated rightsizing |
| Waste rate | Not yet | Track and action | Automated remediation |
| Forecast accuracy | Basic spend tracking | Monthly forecast vs. actual | Weekly, automated alerts |
| Cost per unit of value | Not yet | Pilot for one service | All services, automated |
| GPU utilisation / cost per inference | Not yet | Track for AI workloads | Automated optimisation |
What data sources and tools do you need to collect reliable metrics?
Reliable FinOps metrics require at least four distinct data sources joined together. Missing any one of them creates blind spots that make your KPIs misleading rather than useful.
Required data sources:
- Billing exports — the foundation. AWS Cost and Usage Report (CUR), Azure Cost Management exports, and GCP Billing export to BigQuery provide line-item spend, amortised costs, and commitment data. Without these, nothing else works.
- Tagging inventory — a structured record of which tags are required, which resources carry them, and which do not. Tag coverage below 80% makes allocation metrics unreliable.
- Cloud monitoring — CloudWatch (AWS), Azure Monitor, and Google Cloud Monitoring provide CPU, memory, network, and disk utilisation at the resource level. This data is essential for utilisation and waste metrics; billing exports cannot substitute for it.
- Kubernetes and container metrics — for containerised workloads, namespace-level consumption tracking (via tools such as Kubecost or OpenCost) is necessary. Billing data cannot see inside Kubernetes nodes and cannot infer real resource consumption from pod-level activity.
- Product analytics — transaction counts, active users, API call volumes, or inference counts. Required for unit economics. This data typically lives outside cloud billing systems entirely.
Vendor tools to enable immediately:
AWS Cost Explorer provides reservation and Savings Plan coverage and utilisation reports, rightsizing recommendations, and cost anomaly detection. It is the fastest path to commitment metrics on AWS. Azure Cost Management offers budget alerts, cost analysis by resource group and tag, and advisor recommendations for rightsizing. GCP Billing exports to BigQuery, enabling SQL-based analysis of spend, labels, and SKU-level detail at scale.
Practical tooling notes:
- Normalise billing data to a common schema before joining across providers. The FOCUS specification (FinOps Open Cost and Usage Specification) is the emerging community standard for multi-cloud cost normalisation.
- Enforce tags via infrastructure-as-code and CI/CD gates. A tag policy that only runs in reporting is not a tag policy.
- Handle billing currency carefully for UK teams using multi-region workloads. AWS bills in USD; Azure bills in GBP for UK accounts. Normalise to a single currency before aggregating.
- Set billing export latency expectations: AWS CUR typically has a 24-hour lag; GCP BigQuery export can be near-real-time. Anomaly detection SLAs must account for this lag.
Pro Tip: Build your tagging taxonomy before you build your dashboards. A tag schema that changes after dashboards are live breaks historical comparisons and forces a re-baseline. Agree on the mandatory tag keys (team, service, environment, cost-centre) and enforce them in Terraform or Bicep from day one.
For a practical guide to attributing spend by service, the approach of building service-level cost views from billing exports is a useful starting point before moving to full unit economics.
How to baseline metrics, set targets, and define reporting cadence
A metric without a baseline is an opinion. Before you set targets, you need a reliable starting point that reflects normal operating conditions for your workloads.
Steps to establish a baseline
- Select a data window of at least 90 days, ideally 6 months, to capture seasonal variation and deployment cycles.
- Remove one-off events: migration costs, large data transfers, or incident-driven spend spikes that will not recur.
- Normalise to business volume. If your transaction count grew 40% during the baseline period, your raw spend increase is not waste; it is growth. Divide spend by volume to get a comparable baseline.
- Align the baseline period to your financial year where possible, so targets map cleanly to budget cycles.
- Document the baseline assumptions. When the metric moves, you need to know whether the baseline itself was the problem.
Setting SMART targets by maturity
Targets should be specific, measurable, achievable, relevant, and time-bound. Generic targets (“reduce waste”) produce no behaviour change. Specific targets (“reduce idle resource percentage from 18% to below 10% by end of Q3”) create accountability.
Sample targets by maturity:
- Crawl: allocation rate above 80% within 60 days of tagging enforcement.
- Walk: ESR above 20%, commitment utilisation above 85%, idle resource percentage below 10%.
- Run: forecast accuracy within ±5%, cost per unit trending down quarter-on-quarter, anomaly detection latency below 4 hours.
Reporting cadence
Different audiences need different update frequencies. Engineers need daily cost visibility to catch anomalies before they compound. FinOps practitioners need weekly summaries to track commitment utilisation and waste trends. Finance and leadership need monthly reporting tied to budget cycles and business outcomes.

| Audience | Cadence | Key metrics | Format |
|---|---|---|---|
| Engineering teams | Daily | Resource utilisation, anomaly alerts, idle resources | Dashboard / Slack alert |
| FinOps practitioners | Weekly | ESR, commitment coverage/utilisation, waste rate, allocation rate | FinOps dashboard |
| Finance | Monthly | Total cloud spend, forecast accuracy, ESR, cost per unit | Report / spreadsheet |
| Leadership / board | Monthly | Cost per unit of value, total spend vs. budget, savings delivered | Executive summary |
What commonly breaks FinOps metrics, and how to fix it
Most FinOps metric failures are not data problems. They are process problems. The measurement infrastructure works; the discipline around it does not.
Common anti-patterns:
- Tracking vanity metrics — cumulative savings totals look impressive but obscure whether the rate of improvement is accelerating or stalling. ESR is a better signal because it is a rate, not a running total.
- Low tag coverage treated as acceptable — allocation rates below 80% make every per-team metric unreliable. Teams that report cost allocation with 60% coverage are reporting fiction.
- Billing-only assumptions — assuming billing data captures real utilisation. It does not. A VM billed at 100% of its provisioned cost may be running at 8% CPU utilisation. The FinOps assessment Metrics lens specifically checks whether metrics are defined with collection cadence and relevance, not just whether a number exists.
- Over-reliance on recommendation counts — the number of rightsizing recommendations is not a KPI. The percentage of recommendations acted on, and the verified savings from those actions, are.
- Noisy anomaly alerts — anomaly detection configured with thresholds too low generates alert fatigue. Engineers stop reading the alerts. The signal disappears.
- ESR plateau without coverage improvement — if ESR is flat but commitment coverage is not increasing, you have likely saturated the discount opportunity for your current workload shape. The next lever is usage optimisation, not more commitments.
Red flags to watch:
- Allocation rate below 90% before reporting per-team spend.
- Commitment utilisation below 85% (orphaned commitment cost is pure waste).
- Forecast accuracy variance above ±20% for two consecutive months (the model or the process is broken).
- Anomaly detection latency above 48 hours (by the time you know, the cost has already landed).
Pro Tip: Stop measuring a KPI the moment you cannot act on it. If your team has no process to respond to a high idle resource percentage, the metric creates guilt without change. Fix the process first, then reintroduce the metric.
For a practitioner’s view of common FinOps misconceptions that lead to these anti-patterns, the FinOps isn’t what you think it is post covers the cultural and process failures that undermine even well-instrumented programmes.
How a UK FinOps team measured impact: the Koritsu approach
The pattern we see repeatedly with UK engineering teams starts the same way: a cloud bill that has grown faster than the business, a tagging schema that exists in policy but not in practice, and commitment purchases made without a utilisation baseline.
A typical engagement begins with a structured audit covering four areas: billing export completeness, tag coverage rate, commitment utilisation, and the top 20 cost drivers by service.
The measurement approach matters as much as the metric itself. Savings validated only against list-price estimates are not savings. The only credible validation method is a before-and-after comparison against the same billing export, normalised for volume change, over a minimum 30-day window.
The KPIs chosen for the engagement were allocation rate, ESR, commitment utilisation, and resource utilisation rate per service. Data sources were the AWS Cost and Usage Report joined to CloudWatch metrics, with a tagging enforcement policy deployed via Terraform within the first two weeks.
The measurement cadence was: daily anomaly alerts to engineering leads, weekly ESR and commitment utilisation review with the FinOps lead, and monthly reporting to the finance director covering total spend, ESR, and forecast accuracy.
Measurement and verification steps
- Export billing data for the 90-day baseline period; remove one-off migration costs.
- Deploy mandatory tag enforcement via infrastructure-as-code; measure tag coverage weekly.
- Analyse commitment utilisation; identify orphaned Reserved Instances and exchange or sell them.
- Run rightsizing analysis per service using CloudWatch p99 CPU and memory data over 30 days.
- Implement changes; measure ESR and utilisation rate against the baseline in the following billing period.
- Validate savings against the billing export, not against vendor recommendations.
The UK bidding platform case study on the Koritsu AI site documents a 52% cloud cost reduction achieved through this methodology, with savings verified against billing exports over a 90-day post-implementation window.
What actually makes FinOps metrics stick in UK engineering teams
The teams that get lasting value from FinOps metrics share one characteristic: they treat cost as an engineering concern, not a finance concern. That sounds obvious. In practice, most organisations still route cloud cost conversations through a finance review cycle that engineers never see until the quarterly business review.
What works is embedding cost visibility directly into the tools engineers already use. A cost-per-service view in the same dashboard as latency and error rate changes the conversation. Engineers stop seeing cost as someone else’s problem when it sits next to the metrics they are already accountable for. The FinOps playbook for UK CTOs covers the operational steps for embedding this kind of visibility into sprint rituals.
Ownership is the other lever that most teams underestimate. Assigning a metric to a team without giving that team the authority to act on it produces resentment, not improvement. The FinOps RACI only works when engineering leads have genuine autonomy over rightsizing decisions within their services, and when FinOps practitioners are positioned as enablers rather than auditors.
The practical rule of thumb: if a metric has not driven a decision in the last 30 days, either the metric is wrong or the process around it is broken. Fix one of those two things before the next reporting cycle.
Koritsu AI: from metrics to measurable savings
Most UK engineering teams already have access to the billing data, the monitoring tools, and the cloud vendor dashboards described in this article. The gap is rarely the data. It is the process of joining it, interpreting it, and acting on it consistently.

Koritsu AI combines a continuously monitoring AI agent with hands-on FinOps expertise to close that gap. Kori, the AI agent, surfaces where money is being lost across AWS, Azure, and GCP. Koritsu’s specialists help engineering teams act on those findings, from tagging enforcement and commitment analysis through to architectural root cause fixes. The engagement starts with a free assessment and is charged as a share of the savings actually delivered, so there is no upfront cost and no risk of paying for recommendations that do not land.
The AWS Lambda case study shows a 96% reduction in Lambda costs for a UK financial services group, validated against billing exports. If you want to see what that methodology looks like applied to your workload, request a free assessment and Koritsu’s team will map your current KPI baseline within the first session.
Sources
The references below are the authoritative starting points for implementing and validating FinOps metrics. Each serves a distinct purpose.
- FinOps KPIs
- FinOps maturity model 2026: Crawl, Walk, Run explained | FinOpsForge
- FinOps KPIs & Benchmarks - 83 KPIs | KPI Depot
This article is general information, not a substitute for advice from a qualified financial advisor. Consult a qualified financial professional about your own circumstances before acting on anything here.