FinOps Inform
AWS Cost Anomaly Detection: Fix Alerts in 24 Hours for FinOps
Turn AWS Cost Anomaly Detection alerts into FinOps workflows. Get first alerts in 24 hours, triage by dollar impact, then close anomalies.

AWS Cost Anomaly Detection (CAD) is a machine-learning service that flags unexpected spend and ranks the likely causes by dollar impact. Enable Cost Explorer and a managed monitor today and you’ll receive your first alerts within roughly 24 hours. CAD reports contributors by service, account, region, and usage type, then pushes alerts through SNS or email. So switch it on before your next billing surprise, not after.
TL;DR:
- Most teams should start with AWS managed monitors for broad coverage, but customer-managed monitors are necessary for volatile or specific cost categories.
- Anomalies require about 10 days of historical data before CAD can reliably distinguish genuine issues from noise, especially for new services.
- Alerts are based on thresholds set for business impact, not the model’s sensitivity, so lowering thresholds increases notification volume without changing detection accuracy.
- CAD tracks cost deviations primarily against net unblended cost, making drops in Savings Plan coverage appear as anomalies even if usage remains unchanged.
- Effective anomaly response needs designated ownership, consistent workflow, and documented remediation actions instead of relying solely on alert notifications.
What AWS Cost Anomaly Detection actually does
CAD watches your billing data continuously and learns what “normal” spend looks like for each part of your account. When actual cost deviates from that learned pattern, it raises an anomaly and attaches a root cause breakdown, so you’re not left guessing which service or team caused the spike.
Two monitor types cover different needs. AWS managed monitors auto-track everything within a dimension (up to 5,000 values), which is why most teams start there. Customer-managed monitors let you pin down to 10 specific values, such as one production account or a single cost category, when you need tighter scrutiny somewhere spend is historically volatile.
The features that matter most day to day:
- Root cause ranking: contributors ordered by dollar impact across service, account, region and usage type, with up to 10 causes returned per anomaly.
- Managed vs customer-managed monitors: broad automatic coverage versus narrow, hand-picked scope.
- Alert cadence: immediate notifications through Amazon SNS, or daily and weekly summaries depending on who needs to see what and how often.
- No manual thresholds to train the model: the ML runs regardless; you only tune what gets delivered to you.
How to set up cost anomaly detection step by step
Getting CAD live takes less time than most teams expect, but skipping the groundwork is where setups fail.
- Turn on Cost Explorer first. CAD depends entirely on Cost Explorer’s billing data, so this is non-negotiable. Confirm your IAM user or role has the relevant Billing and Cost Management permissions before you start.
- Create a monitor. Choose AWS managed for broad, low-effort coverage across your whole account structure, or customer-managed when you want to isolate specific accounts, services, or cost categories. Name it something your team will recognise at 2am, not “Monitor1”.
- Build an alert subscription. Decide between SNS and email. SNS is the better default because you can pipe it straight into Slack or Microsoft Teams, turning a lone alert into a shared triage conversation.
- Set the cadence. Immediate alerts suit engineering on-call rotations; daily or weekly summaries suit finance leadership who need visibility without the noise.
- Wait, then verify. Give the system 24 to 48 hours to confirm it is picking up expected patterns. If you’ve just added a new service, budget for closer to 10 days before you trust its judgment fully.
Pro Tip: While you’re inside the initial 10 day training window for a new service, set a manual AWS Budgets alert as a stopgap. CAD isn’t blind during that period, but it hasn’t seen enough history to call something abnormal with confidence yet.
How the detection engine actually behaves
CAD runs its detection cycle roughly three times a day, but it’s only as current as the billing data feeding it, and Cost Explorer’s data can lag by up to 24 hours. That gap matters: an anomaly triggered by a midday spend spike might not surface in the console until the following morning.
New services face a longer runway. CAD needs roughly 10 days of historical usage before it can distinguish a genuine anomaly from normal early-stage noise, which is why a freshly launched workload can run hot for over a week without triggering a single alert.
Data point worth remembering: CAD calculates against net unblended cost, meaning discounts and Savings Plan or Reserved Instance coverage are already baked into the number it evaluates. That’s efficient for spotting real overspend, but it also means a sudden drop in Savings Plan utilisation can mask a raw usage spike underneath, since the discounted figure looks tamer than the unblended reality.
A separate point that trips up new admins:
- Alert thresholds control what gets delivered to you, not what the model detects.
- Every anomaly is still logged and visible in the console, even the ones quiet enough to sit below your threshold.
- Lowering a threshold surfaces more alerts; it does not make the ML “more sensitive” in any technical sense.
Tuning alerts and building a response workflow
Detection is the easy part. Turning anomalies into action without drowning your team in notifications is where most CAD setups either succeed or quietly get ignored.
Start with monitor design. Running an AWS managed monitor and three overlapping customer-managed monitors on the same account structure produces duplicate alerts for the same event, which trains people to skim rather than read. Use the managed monitor as your baseline and add customer-managed monitors only for genuinely exceptional cases, such as a single high-risk production account.
Routing matters just as much as detection. Push alerts through Amazon SNS into a shared team channel rather than an individual’s inbox. A Slack or Teams channel turns “I got an email about this” into a group conversation with context, ownership, and a paper trail.
Set thresholds around business impact, not round numbers. A $50 deviation on a $200 monthly service might be a 25% swing worth investigating; the same $50 on a $50,000 service is noise. Keep that threshold logic entirely separate from the detection model itself, since the two never interact.
When an anomaly lands, work it the same way each time:
- Sort by dollar impact and open the top root cause first, not whichever entry looks most alarming.
- Identify the owning team from the account or service breakdown and loop them in immediately.
- Apply an immediate mitigation (pause, scale down, or roll back) before starting the deeper investigation.
Pro Tip: Assign a rotating “anomaly owner” each week rather than letting alerts land on whoever happens to check Slack first. It sounds trivial, but ownership ambiguity is the single biggest reason anomalies sit uninvestigated for days.
Quotas, limitations and quick fixes
CAD has published quotas on the number of managed and customer-managed monitors and alert subscriptions per account, so check the service quotas documentation if you’re scaling monitors across many teams.
Some scenarios sit outside CAD’s scope entirely:
- Billing transfer views and most third-party Marketplace charges aren’t monitored by CAD; use AWS Budgets alongside it for that visibility.
- Anomalies below your alert threshold never disappear. They stay logged in the console for manual review.
- You need Billing and Cost Management IAM permissions to create monitors, subscriptions, or view anomaly detail pages. Missing permissions are the most common reason a “working” setup shows nothing to a specific user.
The Koritsu view: where CAD stops and deeper analysis begins
CAD is genuinely good at what it’s built for: flagging spend deviations and pointing you toward the likely service, account, or region within hours. What it doesn’t do is tell you why your architecture generates that pattern in the first place. An anomaly caused by a badly rightsized fleet, an inefficient data pipeline, or a poor cost allocation model will keep recurring every month, and CAD will dutifully flag it every single time without ever fixing the root design.
That’s the handoff point. Once an alert lands, someone needs to own the ticket, trace it to an architectural cause, and measure the saving once it’s fixed, not just close the alert. Koritsu AI’s FinOps consulting work sits exactly in that gap, turning a recurring anomaly into a permanent fix rather than a monthly re-alert.
Where to view and filter anomalies in the console
Every anomaly CAD identifies, whether it triggered an alert or sat quietly below your threshold, lives in the Cost Anomaly Detection dashboard within AWS Cost Management. This is the single place to review detection history without relying on your inbox or SNS topic.
The dashboard lists anomalies chronologically with the total cost impact attached to each, so the most expensive incidents are immediately visible without opening every record. Clicking into an anomaly opens the root cause breakdown: which service, account, region, or usage type drove the deviation, and by how much.
Filtering is where the console earns its keep for larger organisations running dozens of monitors. You can narrow the view by:
- Monitor name, useful when you’ve split monitors by business unit or account group.
- Date range, to pull up everything from a specific billing period during a monthly review.
- Total impact, to sort straight to the anomalies that actually moved the needle financially.
- Anomaly status, distinguishing ones you’ve already investigated from ones still open.
For teams running a monthly FinOps review cycle, the console’s anomaly history doubles as an audit trail. You can demonstrate to finance leadership exactly what was flagged, what turned out to be genuine, and what got dismissed as expected seasonal or launch-related spend. That record matters more than most teams realise the first time someone asks “why did nobody catch this in March?” and the answer is sitting right there in the filtered view.
The models behind the detection
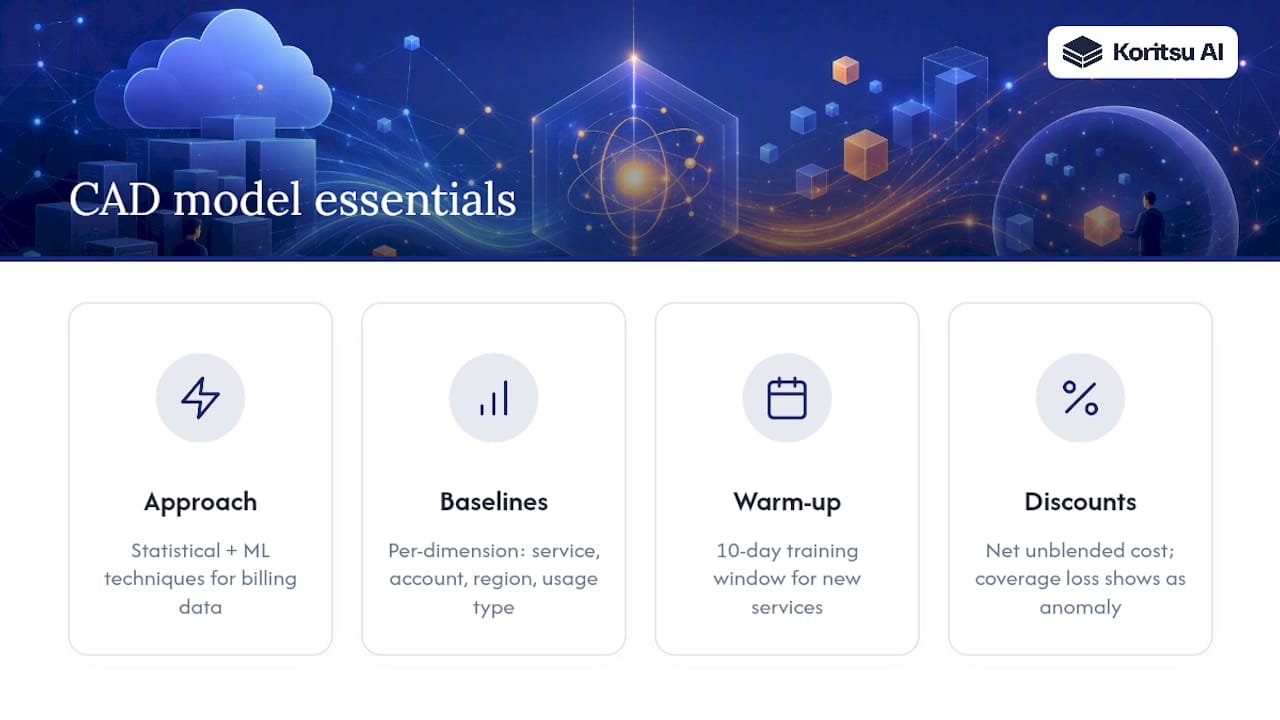
CAD doesn’t expose a single named algorithm the way some standalone anomaly detection products do. Instead, it applies a combination of statistical and machine-learning techniques tuned specifically for the shape of AWS billing data, which behaves differently to generic time-series data because of billing cycles, discount amortisation, and highly seasonal usage patterns (think retail traffic spikes or batch jobs that only run at month-end).
The practical result is a model that learns a baseline for each monitored dimension independently, service, account, region, and usage type, rather than applying one global threshold across your entire bill. That’s why a monitor can correctly flag an anomaly in a single low-traffic service without being drowned out by normal fluctuation in your largest, highest-spend service running alongside it.
Training data quality drives accuracy more than any configuration setting you can adjust. This is precisely why new services need that roughly 10-day window before CAD trusts its own judgment. Attempt to interpret an anomaly flagged on day two of a new workload and you’re reading noise, not signal.
One nuance worth internalising: because CAD models net unblended cost, its baseline already accounts for the discounts you typically receive. A workload that suddenly loses Savings Plan coverage will show up as a cost anomaly, correctly, even though the underlying resource usage hasn’t changed at all. That’s the model doing its job. The fix in that case isn’t architectural; it’s a coverage or commitment gap, which is a different kind of remediation entirely to a genuine usage spike.
Reading real anomaly patterns correctly
A few recurring patterns show up often enough to be worth recognising on sight, rather than treating each one as a fresh mystery.
A sudden spike in a single usage type within one service usually points to a misconfigured job or a runaway process, a batch script that didn’t terminate, an auto-scaling group that scaled up and never scaled back down. The root cause breakdown will usually pin this to one usage type immediately.
A gradual, multi-day climb rather than a sharp spike often signals organic growth outpacing your last rightsizing review, or a slow data leak such as unattached EBS volumes or orphaned snapshots accumulating quietly. These rarely trigger urgent alerts because the daily deviation is small, which is exactly why reviewing anomalies below your threshold in the console matters.
A regional anomaly with no corresponding service-level flag typically means cross-region data transfer costs, a common blind spot when architectures replicate data between regions for redundancy without anyone tracking the transfer bill separately.
An anomaly that appears, resolves, then reappears on a cycle is often tied to a recurring batch process, a nightly ETL job, a weekly reporting pipeline, that genuinely does cost more on certain days. If the pattern is expected and unavoidable, the sensible move is adjusting your monitor’s sensitivity for that dimension rather than re-investigating the same non-issue every week.
Turning an alert into a fix
Detecting an anomaly is only useful if it leads somewhere. The most effective response ties the CAD alert directly to a specific remediation action rather than a generic “someone should look at this” note in a shared channel.
For compute-related spikes, the immediate lever is usually rightsizing or scaling policy correction. Check whether an auto-scaling group’s minimum or maximum bounds were changed recently, and confirm any manually launched instances tied to the anomaly were genuinely needed and haven’t been forgotten since.
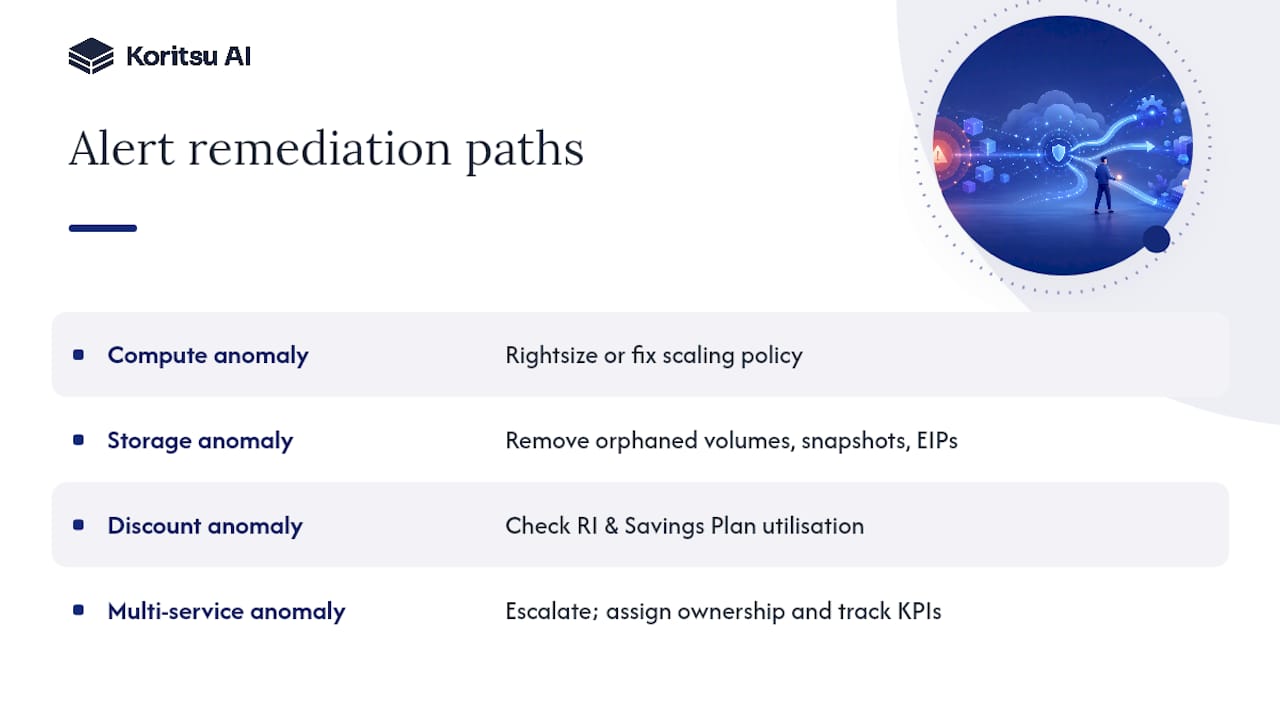
For storage-driven anomalies, hunt for orphaned resources first: unattached volumes, old snapshots, and unused Elastic IPs accumulate quietly and rarely get cleaned up without a deliberate audit. This is one of the more mechanical fixes available and often the fastest to execute.
For discount-related anomalies, the fix lives in your commitment strategy rather than your infrastructure. Check Reserved Instance and Savings Plan utilisation reports alongside the CAD alert to confirm whether coverage genuinely dropped or simply needs rebalancing across accounts.
For anything involving multiple services or a pattern that doesn’t resolve after the obvious fix, escalate rather than iterate alone. Tools like a structured process-mapping framework can help a team formalise “who owns what” once anomaly response becomes routine rather than exceptional, and pairing that with KPI tracking practices makes it easier to confirm a fix actually held over the following billing cycle rather than assuming it did.
Monitor and act: the FinOps playbook that actually works
The judgment this research actually supports is blunter: CAD is a detection layer, full stop, and treating its output as a finished analysis is where most FinOps programmes stall.
Where conventional guidance falls short is ownership. Plenty of teams enable CAD, route alerts to an inbox, and call the job done, then wonder why the same anomaly recurs three months running. An alert without an assigned owner and a measured outcome is just noise with better formatting.
Prioritise the workflow before the tooling. Decide who owns an anomaly ticket, how a fix gets verified against the next billing cycle, and when a recurring pattern gets escalated to architectural review rather than re-investigated from scratch each time. CAD tells you something changed. Turning that into a permanent saving is a different discipline entirely, and it’s the one most teams underinvest in.
Get hands-on help once CAD flags the pattern
CAD tells you that something changed and roughly where. It won’t tell you why your architecture keeps generating the same anomaly every billing cycle, and it certainly won’t fix it. Koritsu AI picks up exactly there: our platform, Kori, runs continuous analysis alongside your CAD alerts, while our FinOps specialists trace recurring anomalies back to their architectural cause and work with your engineers to close them for good.

This suits teams who’ve outgrown “check the dashboard weekly” and need someone who’ll actually sit with an anomaly until it’s genuinely resolved. One UK bidding platform worked with Koritsu AI and cut cloud costs by 52% following a full engineering-grade review, well beyond what alert monitoring alone could have surfaced. You start with a free assessment, and we only take a share of the savings we actually find. If your CAD alerts keep repeating the same story every month, that’s the point to get in touch.
Sources
For console steps and current quotas, see Getting started with AWS Cost Anomaly Detection and Detecting unusual spend. For behavioural specifics, check the official FAQs.
- Getting started with AWS Cost Anomaly Detection