FinOps Inform
Cloud spend alerting for engineering teams: stop surprise bills
Discover how cloud spend alerting engineering teams can prevent surprise bills. Implement anomaly detection and budget alerts today!

Use paired anomaly detection and forecasted budget alerts, routed to team-owned channels with a short runbook and programmatic notifications. That single architectural decision is what separates engineering teams that catch a runaway training job at £200 from those that discover it at £20,000 on the monthly invoice.
The cloud total cost of ownership problem is rarely a technology gap. It is a process gap: teams lack the detection layer that tells them something has gone wrong before the billing cycle closes. Here is what to put in place immediately:
- Scope budgets to team, service, or feature level using resource tags or GCP projects/AWS accounts.
- Enable provider budget alerts with both actual and forecasted thresholds from day one.
- Wire Pub/Sub or webhook notifications to a team-owned Slack channel or PagerDuty service.
- Assign a named alert owner per budget scope, not a shared inbox.
- Write a three-step runbook before you go live, not after the first incident.
Three foundations underpin this playbook. The FinOps Foundation's anomaly management working group provides the governance model. Native cloud provider budget features (GCP, AWS, Azure) give you a working starting point in under an hour. And Koritsu AI's practical experience with UK engineering teams shows that the teams who act fastest are those who already have a runbook and a named owner when the alert fires.
Anomaly detection versus budget alerts: which does your team actually need?
Most engineering teams need both, but they solve different problems. Confusing them leads to either alert fatigue or blind spots.
Budget and forecast alerts compare actual or projected spend against a fixed threshold you set in advance. They are deterministic: spend crosses 50%, 90%, or 100% of your monthly budget, an alert fires. They are straightforward to configure, predictable in behaviour, and well-suited to steady workloads where you have a reasonable sense of expected spend. The weakness is that they are retrospective by nature: a 50% threshold alert on a £10,000 monthly budget will not fire until you have already spent £5,000, even if that happened in the first two days of the month.
Anomaly detection works differently. Rather than comparing against a fixed number, it compares current spend against a learned baseline of what "normal" looks like for that workload. An ML-based detector notices that your Cloud Run costs jumped 400% on a Tuesday afternoon when they normally stay flat, and fires an alert within hours, not weeks. This is the right tool for bursty, unpredictable workloads: model training pipelines, batch ETL jobs, event-driven architectures, and any environment where spend is legitimately variable but should follow a recognisable pattern.
Two concrete examples illustrate the difference:
- A model training spike: a data scientist accidentally triggers a GPU cluster job against the full production dataset instead of a sample. Spend jumps from £30/hour to £900/hour. A budget alert at 80% of a £50,000 monthly budget would not fire for days. An anomaly detector, comparing against a rolling 14-day baseline, fires within two billing intervals.
- An unattended dev environment: a developer leaves a cluster running over a bank holiday weekend. Spend drifts upward slowly. Anomaly detection may not flag this as unusual if the baseline is noisy. A forecast alert, projecting the month-end trajectory, catches the drift and fires before the weekend ends.
| Dimension | Budget / forecast alert | Anomaly detection |
|---|---|---|
| Latency to detect | Hours to days (threshold-based) | Minutes to hours (pattern-based) |
| False-positive profile | Low but misses sudden spikes | Higher; needs tuning |
| Setup effort | Low (native provider tools) | Medium to high |
| Best for | Steady workloads, governance | Bursty, unpredictable spend |
| Remediation style | Planned response | Immediate triage |
How anomaly detection actually works: baselines, models and signal sources
The core mechanism is always the same: establish what normal looks like, then score deviations against it.
Baselines are typically built from rolling windows (7, 14, or 28 days of billing history) with optional seasonal decomposition to account for weekly patterns. A service that spends heavily every Monday due to a scheduled batch job should not trigger an alert every Monday. Simple statistical approaches use z-scores or interquartile range thresholds against the rolling window. More sophisticated ML approaches fit time-series models (ARIMA variants, Prophet, or gradient-boosted regressors) that handle seasonality and trend simultaneously. The trade-off: statistical rules are transparent and easy to debug; ML models are more accurate on complex patterns but require more data and more maintenance.
Aggregation level matters enormously for signal quality. Monitoring at account or billing-project level gives you a strong signal but poor localisation: you know something is wrong, not where. Monitoring at service level (Compute Engine, Lambda, Azure OpenAI) narrows it. Tag or label level (team, feature, environment) gives you the most actionable signal, but only if your tagging is consistent. The practical recommendation is to run detection at multiple levels simultaneously: account-level for governance, service-level for triage, and tag-level for team ownership.
Signal sources worth feeding into your detection layer:
- Create, edit, or delete budgets and budget alerts | Cloud Billing | Google Cloud Documentation
- Cost Management | Google Cloud
- finops.org
- finops.org
- learn.microsoft.com
- Cost Accountability for Engineering Teams
- Engineering Budget Management: A Guide for EMs | Engineering Manager Tools
- g2.com
Two tuning parameters reduce noise significantly. First, a minimum volume threshold: do not alert on a service spending £2/day regardless of percentage change. Second, a smoothing window: average billing data over two or three intervals before scoring, so a single anomalous data point does not trigger an alert. Tie cloud observability metrics to your cost signals and you get a much cleaner detection layer.
When are native cloud tools enough, and when do you need more?
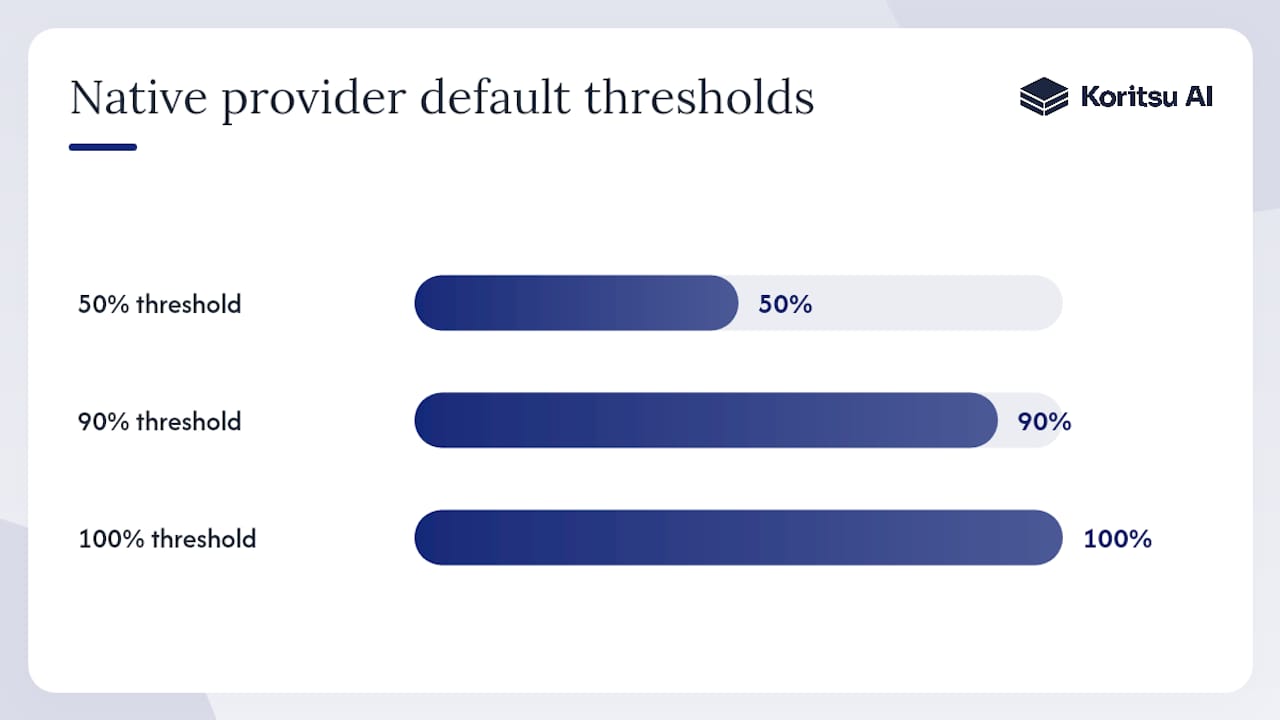
Native provider tooling is the right starting point for most teams. GCP Budgets support both actual and forecasted cost thresholds, default alert levels at 50%, 90%, and 100%, and can publish programmatic notifications via Pub/Sub for automation. AWS Budgets offers similar threshold alerting with SNS integration. Azure Cost Management provides anomaly detection alerts and diagnostic signals for investigating unexpected charges. For a single-cloud team with a modest spend and straightforward workloads, these tools cover the basics without any additional investment.
The limits become apparent quickly at scale. Native tools typically aggregate at billing-account or subscription level, making team-level or feature-level budgets difficult without significant account restructuring. Anomaly detection in native tools tends to be rule-based rather than ML-driven, which means it struggles with workloads that have complex seasonal patterns. Cross-provider correlation is absent: if you run on both AWS and GCP, you need two separate alert stacks with no unified view. Integration endpoints are limited: Pub/Sub and SNS work, but wiring them into PagerDuty, Slack, or a custom incident management system requires additional engineering work.
Third-party and custom solutions address these gaps. Specialised engineering budget alert tools, such as those listed on G2's StackSpend category, offer pace-to-forecast alerts, per-team budget scopes, and multi-scope notifications that native tools do not. Custom detection built on top of billing exports gives you full control over model choice, aggregation, and routing.
Decision checklist for your team:
- Single cloud, spend under £50k/month, simple workloads: native budgets are sufficient.
- Multi-cloud or spend above £50k/month: consider a unified third-party layer.
- Complex seasonal workloads (ML training, batch ETL): ML-based anomaly detection adds meaningful value.
- Need tight CI/CD integration or custom escalation logic: custom or third-party tooling.
- Team ownership model with per-squad budgets: native tools require account restructuring; third-party tools handle this natively.
Pro Tip: Start with native provider budgets this week. They take under an hour to configure and give you immediate coverage. Layer anomaly detection on top once you have two to four weeks of baseline billing data and a clear picture of which workloads are genuinely bursty.
Google Cloud's cost management guidance recommends budgets, dashboards, and automated budget actions as the foundation before adding more sophisticated controls.
The engineering alerting playbook: thresholds, routing and runbooks
Threshold presets
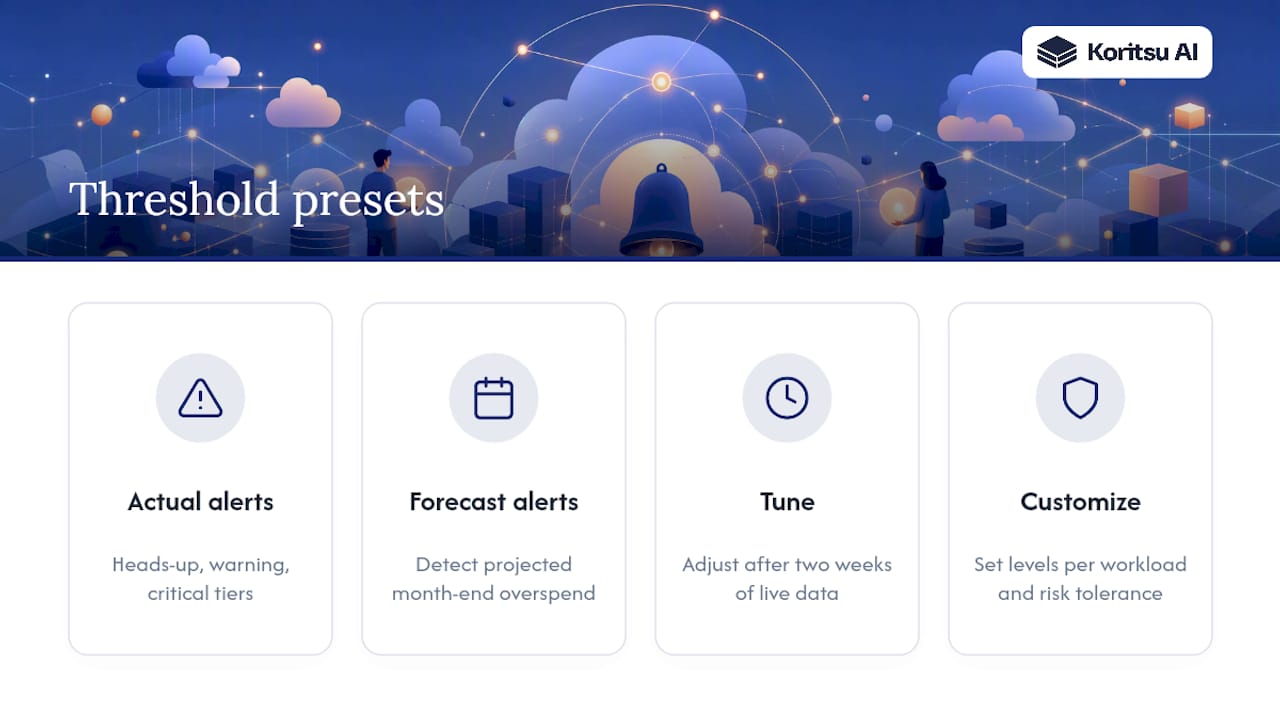
Start with default alert thresholds for actual and forecast spend and tune after two weeks of live data. Use a multi-tiered approach for actual spend alerts, with thresholds that indicate heads-up, warning, and critical levels. Use forecast alerts to indicate when projected month-end spending may exceed the budget. Adjust the specific threshold levels based on your team's workload and risk tolerance, emphasizing forecast alerts to catch slow spending drifts.
Routing rules
Route alerts to the right audience at the right severity. Sending every alert to a shared ops channel is the fastest route to alert fatigue.
- 50% actual: post to the team's cost Slack channel (#team-costs or equivalent). No page, no email.
- 90% actual or 110% forecast: post to the team channel and notify the engineering lead via direct message.
- 95% actual or 100% actual: page the on-call engineer via PagerDuty. Copy the FinOps lead by email.
- 100% actual (account level): notify finance and the CTO. Trigger the emergency runbook.
The benefits of automated cloud cost alerts are only realised when routing is precise. A noisy channel trains engineers to ignore it.
Runbook template
Every alert scope should have a three-step runbook attached before go-live.
- Triage (target: under 15 minutes): check the billing dashboard for the affected scope. Identify which service or resource is driving the spike. Cross-reference with recent deployments in the CI/CD log.
- Quick mitigations: scale down or pause the offending resource if safe to do so. Apply a quota or rate limit if the spike is API-driven. For an unattended environment, shut it down. For right-sizing and scheduled shutdowns, follow the team's pre-approved automation scripts.
- Escalation: if the cause is unclear after 30 minutes, escalate to the platform team. If spend is still rising at 100% of budget, notify the FinOps lead and consider pausing the pipeline with human confirmation.
Programmatic notification payload
A GCP Pub/Sub budget notification delivers a JSON payload your platform can consume directly. A minimal structure for automation:
{
  "budgetDisplayName": "team-payments-monthly",
  "alertThresholdExceeded": 0.95,
  "costAmount": 9512.40,
  "costIntervalStart": "2026-06-01T00:00:00Z",
  "budgetAmount": 10000.00,
  "budgetAmountType": "SPECIFIED_AMOUNT",
  "currencyCode": "GBP"
}
Your automation layer reads alertThresholdExceeded to determine severity, budgetDisplayName to identify the owning team, and costAmount to calculate remaining headroom. Wire this to a Cloud Function or Lambda that posts to Slack and opens a PagerDuty incident at the 95% threshold.
Pro Tip: Prefer soft throttles and visibility-first automations. Automatically posting a Slack message or opening a low-priority ticket is always safe. Automatically scaling down a production service is not. Reserve destructive or scaling actions for emergency flows that require explicit human confirmation before executing.
Ownership, tagging and FinOps practices that make alerting stick
Alerting without ownership is noise. The FinOps Foundation's cost allocation capability is explicit: accurate attribution is the prerequisite for team-level accountability and action.
The ownership model that works in practice has three tiers. Engineering teams own their budget scopes and are responsible for triage and quick mitigations. A platform or infrastructure team owns account-level guardrails and the alerting infrastructure itself. A central FinOps function (or the engineering lead in smaller organisations) owns escalation lanes, monthly reviews, and threshold tuning.
Tagging is where this breaks down most often. A minimum tag hygiene checklist for meaningful team-level budgets:
teamorsquad: the owning engineering team.environment: production, staging, development, or sandbox.serviceorcomponent: the application or microservice.cost-centre: maps to the finance allocation model.
Enforce tags at resource creation via policy (AWS Service Control Policies, GCP Organisation Policies, Azure Policy). Untagged resources should be flagged in a weekly hygiene report, not silently absorbed into an unallocated bucket. A cloud deployment cost checklist can help teams embed tagging into their provisioning workflow from the start.
On showback versus chargeback: start with showback. Give teams visibility into what they are spending before you introduce financial consequences. Practitioner guidance is clear on this: showback first, then unit economics, then chargeback when the team has the tools and the context to act on it. Moving to chargeback before teams understand their cost drivers creates friction without behaviour change.
For alert response SLAs, a pragmatic starting point: acknowledge a 95% threshold alert within 30 minutes during business hours, within two hours out of hours. Resolve or escalate within four hours. These targets should be written into the runbook, not left implicit.
How do you measure whether your alerting is actually working?
Alerting is not a set-and-forget configuration. It needs the same measurement discipline you apply to any other operational system.
- Mean time to detect (MTTD): the gap between when a cost anomaly begins and when an alert fires. Target under two billing intervals for anomaly alerts; under 24 hours for budget threshold alerts.
- False positive rate: the proportion of alerts that, on investigation, have a legitimate business explanation (a planned campaign, a scheduled batch job). Target below 20% after the first month of tuning. Above 30% and engineers will start ignoring the channel.
- Alert volume per week: track the raw count. A sudden increase signals either a real problem or a threshold that needs raising. A sustained zero suggests thresholds are set too high.
- Mean time to remediate (MTTR): from alert acknowledgement to the spend returning to baseline. Track this per team and per alert type.
- Cost avoided (estimated): the difference between the projected month-end spend at the time of alert and the actual month-end spend after remediation. This is a proxy, not an exact figure, but it is the metric that justifies the investment to finance.
A simple reporting template for weekly review:
| Period | Alerts fired | False positives | Incidents escalated | Estimated cost avoided |
|---|---|---|---|---|
| Week of [date] | [n] | [n] | [n] | £[amount] |
Run a weekly alert review to identify noisy signals and suppress or retune them. Adjust thresholds monthly based on actual spend patterns. Quarterly, review the anomaly model itself: has the workload changed enough that the baseline needs retraining? A cost dashboard that surfaces MTTD and false positive rate alongside spend trends makes this review a ten-minute exercise rather than a manual data pull.
How Koritsu AI helps UK engineering teams implement this
Koritsu AI's approach combines continuous AI analysis with engineering-grade runbooks and hands-on FinOps consulting. The AI agent, Kori, analyses billing exports across AWS, GCP, and Azure continuously, surfaces anomalies against learned baselines, and generates a prioritised list of quick wins. The consulting team then works with your engineers to wire alerts into your existing tooling, write the runbooks, and assign ownership, rather than handing over a report and leaving.
The engagement model is designed to remove the risk of getting started. Koritsu AI begins with a free assessment that includes a full inventory of your cloud spend by team, service, and environment; an anomaly snapshot showing where spend has deviated from baseline in the past 30 days; and a recommended quick-wins list with estimated savings. There is no upfront fee: Koritsu AI charges a share of the savings actually realised, verified against billing data.
For UK engineering teams, the practical value shows up quickly. A UK bidding platform worked with Koritsu AI and achieved a 52% reduction in cloud costs, with the savings identified through exactly the kind of architectural and alerting analysis described in this playbook.
The FinOps Foundation's anomaly management guidance reinforces this: anomaly reviews work best when they are embedded in the operating rhythm engineering already uses, not bolted on as a separate finance process.
Key takeaways
Effective cloud spend alerting requires paired anomaly detection and forecast budget alerts, routed to named owners with a pre-written runbook and programmatic notifications wired to team channels.
| Point | Details |
|---|---|
| Use a dual alert strategy | Combine anomaly detection for sudden spikes with forecast budget alerts for slow drift. |
| Set three-tier thresholds | Use 50%, 90%, and 95% actual plus 110% forecast as starting defaults, then tune after two weeks. |
| Assign named owners | Every budget scope needs a named alert owner; shared inboxes create blind spots. |
| Measure MTTD and false positives | Track mean time to detect and false positive rate weekly; target below 20% false positives after month one. |
| Koritsu AI free assessment | Start with a no-cost inventory scan, anomaly snapshot, and quick-wins list before committing to any tooling. |
Engineering buy-in is the variable most teams underestimate
The playbook in this guide is not technically complex. The thresholds, the Pub/Sub wiring, the runbook template: any competent platform engineer can implement them in a week. What takes longer is getting engineers to care about the alerts once they are live.
The teams I see succeed are not the ones with the most sophisticated anomaly models. They are the ones where the engineering lead has made cost visibility a normal part of the sprint review, where the runbook is in the same place as the incident response docs, and where the alert channel is treated with the same seriousness as a latency alert. Cost is not a finance problem that engineering tolerates. It is an engineering problem that finance cares about.
The instinct to gate work behind cost approvals is understandable but counterproductive. Visibility first, friction second. Give engineers the unit economics to understand what their choices cost, make the efficient path the easy path, and the behaviour follows. The teams that struggle are the ones that skip the visibility step and go straight to chargeback, then wonder why engineers feel surveilled rather than informed.
A real-time alerting process, as Netverge's guidance on alert routing outlines, is most effective when escalation paths are defined in advance and every alert has a clear owner. That principle applies to cloud cost alerting as much as it does to infrastructure monitoring.
What a Koritsu AI assessment gives you
Surprise cloud bills are fixable. The gap between a team that catches a runaway job at £200 and one that finds it at £20,000 is almost always a missing alert owner and an unwritten runbook, not a missing tool.

Koritsu AI's free assessment gives you three things in under two weeks: a full inventory of your cloud spend mapped to team, service, and environment; an anomaly snapshot showing where spend has deviated from baseline in the past 30 days; and a prioritised quick-wins list with estimated savings attached to each item. No upfront cost. Koritsu AI charges a share of the savings it actually finds, verified against your billing data. From there, teams move onto a subscription for continuous monitoring, ongoing anomaly detection, and FinOps support.
If you are ready to stop discovering problems on the invoice, book your free cloud cost assessment and see what Koritsu AI finds in your environment.
Useful sources and further reading
Start with the provider budget documentation and FinOps guidance before building anything custom. These are the sources that informed this playbook.
- GCP Budgets documentation: the definitive reference for configuring actual and forecast thresholds, default alert levels, and Pub/Sub programmatic notifications on Google Cloud.
- Google Cloud cost management: Google's own guidance on using budgets, dashboards, and automated actions to drive cost accountability.
- FinOps Foundation: managing cloud cost anomalies: working-group output on detection patterns, team ownership, and operating rhythm for anomaly management.
- FinOps Foundation: cost allocation capability: the framework for why accurate attribution is the prerequisite for team-level action.
- Azure: analyse unexpected charges: Microsoft's investigation guide for diagnosing anomalous Azure billing, including diagnostic signals and API references.
- Cost accountability for engineering teams: practitioner guidance on showback-first, unit economics, and making the efficient path the default.
- Engineering budget management for EMs: practical recommendations on ownership assignment, right-sizing, and scheduled shutdowns for non-production environments.
- G2: StackSpend: illustrates the feature set of specialised engineering budget alert tools, including pace-to-forecast alerts and per-team budget scopes, useful for evaluating the third-party category.