FinOps Inform
Cloud unit economics for engineering and FinOps teams
Discover how to optimize your cloud spending by applying unit economics in engineering and FinOps for better financial visibility.

Cloud unit economics measures your cloud spend against a single meaningful unit of business output, cost per customer, per transaction, per API call, so you can tell whether rising spend reflects efficient growth or quiet inefficiency. According to Datadog's cloud unit economics guide, organisations typically see around 29% of their cloud budgets go unmonitored through unwatched usage and sub-optimal configuration. The FinOps Foundation positions unit economics as the capability that converts cloud billing into a shared business language, and Microsoft's FinOps guidance recommends mapping each unit to supporting services and automating data collection from the outset. Your first practical step: export your detailed billing data, pick one candidate unit that maps directly to a business outcome, and join those two datasets. Everything else follows from that.
- Start with your cloud provider's detailed billing export (AWS Cost and Usage Report, Azure Cost Management export, or GCP Detailed Billing).
- Choose one unit that your product team already tracks (active customers, API calls, transactions).
- Join billing rows to that unit using a shared identifier such as a tenant ID or service tag.
- Publish a single number: cost per unit this month versus last month.
Key takeaways
Cloud unit economics works when the denominator comes from your application telemetry, the allocation logic is documented and repeatable, and the metric is owned by engineering, not just FinOps.
| Point | Details |
|---|---|
| Choose one unit first | Pick the unit closest to a business outcome your product team already tracks, and commit to it for at least two quarters. |
| Telemetry before calculation | The denominator lives in your application logs, not the billing console; instrument it before attempting any unit cost calculation. |
| Proportional allocation | Allocate shared costs using a single, documented driver per resource (CPU share, query volume, data transfer) to keep the model auditable. |
| 8-week pilot scope | A focused pilot on one product and one unit, following the phased assess-pilot-automate-govern timeline, is enough to prove value. |
| Koritsu AI free assessment | Koritsu AI connects billing data to application telemetry, builds the allocation model, and charges only on verified savings, starting with a free assessment. |
How do you choose the right unit of value?
The unit you pick determines whether your cost data drives decisions or just fills a dashboard. Get it wrong and you will spend months producing a metric nobody acts on.
A good unit sits close to a business outcome, can be measured reliably from existing telemetry, stays stable enough to compare month-over-month, and is something an engineer or product manager can actually influence. If a unit fails any of those tests, it is the wrong unit for now.
Product type guides the choice. For a SaaS multi-tenant product, cost per active customer or cost per active seat is usually the clearest signal because it maps directly to gross margin. A marketplace or transaction platform should track cost per transaction or cost per order, since volume and value vary independently. Media and streaming products tend to use cost per stream-hour or cost per GB delivered, because egress and compute dominate the bill. AI and ML inference workloads almost always need cost per inference or cost per model call, given how dramatically batch size and model size affect spend. Platform API products should track cost per API call, broken down by endpoint where call volumes differ significantly.
The trade-off between units is real. Cost per customer is intuitive for finance and product conversations but can mask wide variance between customer tiers. Cost per transaction is granular and actionable but noisy if transaction sizes vary. Cost per API call is precise and easy to instrument but can feel abstract to anyone outside engineering. Cost per deployment is useful for platform teams but disconnected from revenue.
Pro Tip: Start with the unit your product team already reports to the board. You will get faster buy-in and spend less time explaining what the number means.
What data and telemetry do you actually need?
The denominator for unit economics almost never lives in the billing console. It lives in your application logs, your production database, or your event stream. That is the critical engineering insight most teams miss when they start.
Here is the full checklist of what you need to instrument before you can calculate a reliable unit cost.
- Detailed billing export. Enable your provider's line-item billing export: AWS Cost and Usage Report (CUR), Azure Cost Management export to a storage account, or GCP Detailed Billing export to BigQuery. These give you resource-level spend with timestamps, resource IDs, and usage quantities.
- Consistent resource tagging. Every resource must carry tags for service, team, environment, and tenant or customer ID. Ownership rules matter: agree which team owns each tag key and enforce it via infrastructure-as-code or a tag policy. Untagged resources are typically the single biggest source of allocation errors.
- Application telemetry. Instrument your application to emit a business event for each unit: a transaction completed, an API call served, an inference returned. Tools such as Datadog APM, Azure Monitor, or OpenTelemetry-compatible collectors can capture these signals alongside latency and error rates.
- Business signals from your production database. Monthly active customer counts, transaction volumes, and seat counts typically live in your product database. Export these on the same time window as your billing data (daily or hourly, depending on your granularity target).
- Service-level metrics. For shared infrastructure (Kubernetes clusters, message queues, shared databases), collect CPU, memory, and request-count metrics per tenant or service. These become your allocation drivers.
When telemetry is missing, do not guess. Instrument the gap first, even if it delays your first calculation by two weeks. A unit cost built on estimated denominators will be wrong in ways that are hard to detect and easy to misinterpret.
Pro Tip: Use Azure Monitor and service-specific telemetry APIs to correlate usage with cost at the resource level before you attempt any allocation.
How do you calculate cost per unit step by step?
The core formula is straightforward:
Cost per unit = attributable cloud spend ÷ total units in the same period
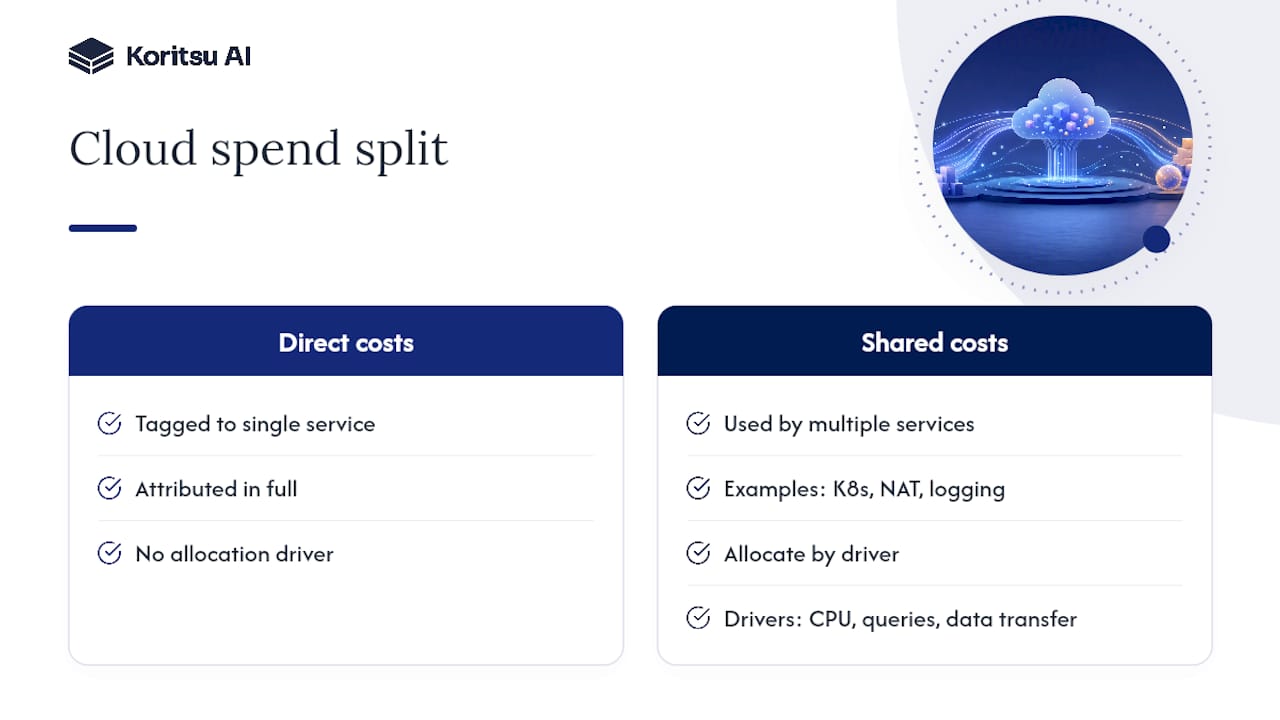
The complexity is in the numerator. Cloud spend splits into two categories: direct costs and shared costs.
Direct costs are resources tagged to a single service or tenant. You attribute these in full to that service or tenant. Shared costs are resources used by multiple services (a shared Kubernetes cluster, a NAT gateway, a centralised logging stack). These need an allocation driver.
Worked example: cost per active customer
Suppose your SaaS product runs on a shared Kubernetes cluster and a few dedicated microservices.
Product A had 1,200 active customers that month.
Cost per active customer = £7,860 ÷ 1,200 = £6.55
For the allocation itself, choose a single well-understood driver for each shared resource rather than complex, fragile heuristics. CPU share works for compute. Query volume works for databases. Data transfer volume works for networking. Document the driver and the calculation so any engineer or finance analyst can reproduce it. Proportional allocation with a documented driver is typically more trustworthy than sophisticated models that nobody can audit.
Practical notes on the numbers: use a consistent time window (calendar month is standard). Strip out credits and committed-use discounts from the numerator only if you want to see list-price efficiency; include them if you want the actual cash cost. Round to two decimal places for reporting. Recalculate the allocation percentages each month as usage patterns shift.
How do you operationalise unit economics inside your team?
Calculating the number once is easy. Making it a decision-ready metric that engineering, FinOps, and finance all trust and act on is the hard part. That requires clear KPIs, owned dashboards, and a meeting cadence that keeps the data alive.
KPIs worth tracking:
- Cost per active customer (or seat, or tenant)
- Cost per transaction or API call, by endpoint
- Cost per deployment (for platform engineering teams)
- Tagging coverage rate (percentage of spend with complete tags)
- Unallocated spend rate (untagged spend as a percentage of total)
- Reserved instance or savings plan utilisation rate
Finance and FinOps need monthly trend lines, allocation breakdowns by team, and a forecast. Avoid long accounting-style reports for engineers. Dashboards tend to lose adoption when they are technically accurate but operationally unhelpful. Tie every cost view to a remediation action: rightsizing, autoscaling, or an anomaly investigation.
Ownership and cadence:
- Daily: automated anomaly alerts to the owning team's Slack channel or ticketing system.
- Weekly: a 30-minute FinOps ops review covering the prior week's unit cost movement and any open anomalies.
- Monthly: a cross-functional review with engineering leads and finance covering trends, allocation accuracy, and forecast versus actuals.
- Quarterly: an allocation policy audit and a review of whether the chosen unit still maps to the business model.
Integrating unit metrics into forecasting means feeding cost-per-unit trends into your capacity planning model. This is where unit economics connects to product pricing and gross margin conversations.
What mistakes do most teams make with unit economics?
Most teams hit the same set of problems in their first three months. Knowing them in advance saves weeks of rework.
- Incomplete tagging. Untagged resources mean unallocated spend, which either gets written off or spread arbitrarily. The remedy: enforce tagging at resource creation via infrastructure-as-code policies, and track tagging coverage as a KPI. Aim for 95% tagged spend before publishing unit costs externally.
- Fragile allocation logic. Teams sometimes build allocation rules that depend on a specific resource naming convention or a manual lookup table. When the infrastructure changes, the allocation breaks silently. Keep allocation rules simple, documented, and version-controlled.
- Relying only on the billing console. The billing console shows you what you spent. It does not show you whether that spend was justified. Without the denominator from your application telemetry, you cannot distinguish efficient scaling from inefficiency.
- Opaque dashboards that engineers distrust. If engineers cannot trace a cost figure back to a specific resource or allocation rule, they will ignore the dashboard. Prefer simple, explicit allocation rules that are repeatable and easily audited by both engineering and finance.
- Changing the unit mid-programme. Switching from cost per customer to cost per seat three months in breaks your trend line and erodes confidence. Commit to a unit for at least two quarters before reconsidering.
What does a realistic rollout timeline look like?
Getting from zero to reliable unit metrics typically takes 8 to 12 weeks for a focused pilot on a single product. Here is a realistic phased view.
| Phase | Weeks | Key activities | Success criteria |
|---|---|---|---|
| Assess | 1–2 | Audit tagging, identify billing export gaps, select pilot unit | Tagging coverage baseline documented |
| Pilot | 3–5 | Instrument telemetry, join billing to business events, calculate first unit cost | First reproducible unit cost published |
| Automate | 6–8 | Build pipeline, publish dashboard, set anomaly alerts | Dashboard live, alerts firing correctly |
| Govern | 8–12 | Embed in sprint reviews, quarterly allocation audits, expand to second product | Unit cost in monthly business review |
Resourcing matrix:
| Role | Responsibility | Estimated effort |
|---|---|---|
| FinOps lead | Allocation model, governance, stakeholder reporting | 2–3 days per week during pilot |
| Platform or data engineer | Billing export pipeline, telemetry joins, dashboard build | 3–4 days per week during pilot |
| Product owner | Define the unit, validate business event counts | 2–4 hours per week |
| Engineering lead | Tag enforcement, architecture input, anomaly triage | 2–4 hours per week |
A pilot scoped to one product, one unit, and one month of historical data is enough to prove value. The goal is a single reproducible number with a documented method, not a perfect allocation model.

Which tools should you use for unit economics?
The integration stack for unit economics has four layers, and you do not need to buy everything at once.
- Billing export and data warehouse. AWS CUR to S3 and then to Athena or Redshift, Azure Cost Management export to a storage account and then to Synapse or Databricks, or GCP Detailed Billing to BigQuery. This is the foundation. Without line-item billing data in a queryable store, nothing else works.
- Telemetry and observability. Datadog, Azure Monitor, or an OpenTelemetry-compatible collector captures application events and service metrics. These provide the denominator and the allocation drivers for shared infrastructure.
- FinOps platforms. Specialised platforms accelerate allocation, anomaly detection, and continuous optimisation. They are worth adopting when the DIY pipeline becomes a maintenance burden or when you need multi-cloud normalisation. The decision to buy versus build usually arrives around the point where your data engineer is spending more than two days a week maintaining the pipeline.
- BI and visualisation. Looker, Power BI, or Grafana for engineering-facing dashboards. The key is keeping the views compact and tied to ownership. A single Grafana dashboard per service, showing cost per unit and a 30-day trend, is more useful than a comprehensive BI report that nobody opens.
For cloud cost attribution in microservices architectures, the data warehouse plus observability combination is usually the right starting point before investing in a dedicated FinOps platform.
An 8-week pilot playbook you can run now
This is a concrete runbook for a FinOps lead and a platform engineer working together on a first pilot.
- Week 1: Assess. Pull your billing export for the last 90 days. Calculate tagging coverage (tagged spend ÷ total spend). Identify the top five untagged resource groups. Document the candidate unit and confirm the product team can supply the denominator from their database.
- Week 2: Tag and instrument. Fix critical tagging gaps via infrastructure-as-code. Add a business event to your application for each unit occurrence (for example, a log line or metric increment per completed transaction). Confirm the event lands in your observability platform.
- Weeks 3–4: Build the join. Write a query that joins billing rows to business events on a shared key (tenant ID, service tag, or resource ID). Calculate cost per unit for the prior month. Validate the number with the product owner.
- Week 5: Allocate shared costs. Identify your top three shared resources by spend. Choose one allocation driver per resource. Apply proportional allocation and add the result to your unit cost calculation. Document the method in a shared wiki page.
- Week 6: Publish the dashboard. Build a single dashboard showing cost per unit for the current month, the prior month, and a 30-day trend. Add one anomaly alert (for example, cost per unit up more than 15% week-on-week). Share with the engineering lead and FinOps stakeholders.
- Weeks 7–8: Embed and govern. Present the unit cost in the next sprint review. Agree on a monthly review cadence. Document the allocation rules and the pipeline so a second engineer can maintain it.
Pro Tip: The join between billing rows and tenant IDs is typically the hardest step. If your resources are not tagged with tenant IDs, start there before anything else. A two-week tagging sprint before the pilot proper will save you far more time than it costs.
Koritsu AI typically engages at weeks 1–2 to accelerate the assessment and tagging audit, then works alongside the platform engineer to build the billing join and allocation model. The most common blocker we remove is the gap between billing data and application telemetry: most teams have both datasets but have never connected them.
What actually separates teams that make unit economics stick?
The technical work is the easier half. The harder half is cultural.
Teams that succeed treat unit cost as a shared metric, not a FinOps metric. When an engineering team owns a cost-per-customer number the same way they own an SLA, the behaviour changes. Engineers start asking whether a new feature will move the unit cost before they build it. Product managers include cost per unit in their roadmap trade-offs. That shift does not happen because you published a dashboard. It happens because a senior engineering leader made it explicit that unit cost is an engineering outcome, not a finance audit.
Teams that struggle tend to have one of two problems. Either the data is distrusted (because the allocation logic is opaque or the numbers change without explanation), or the metric is owned by FinOps alone and never reaches engineering. Both are fixable. Transparent allocation rules, version-controlled and documented, resolve the trust problem. Embedding unit cost in sprint reviews and OKRs resolves the ownership problem.
One pattern worth flagging: the benefits of cloud cost unit metrics compound over time. The first month's number is rarely accurate enough to act on. The third month's number, after two rounds of allocation refinement, usually is. Teams that give up after month one because the number looks wrong are abandoning the process at exactly the point it starts to work.
How Koritsu AI accelerates your unit economics programme
Most engineering teams have the data they need. What they lack is the time and the method to connect it correctly. Koritsu AI closes that gap faster than an internal build, and without the upfront cost of a traditional consultancy retainer.

Koritsu's AI agent, Kori, continuously analyses your cloud billing across AWS, Azure, and GCP, surfacing where spend is growing faster than your unit volume. Our FinOps specialists then work alongside your engineering team to build the allocation model, instrument the telemetry pipeline, and publish a dashboard your team will actually use. The engagement starts with a free assessment, and we charge a share of the savings we verify against your billing data. There is no fixed fee until we deliver a result. For a concrete example of what that looks like in practice, see the 52% cloud cost reduction we delivered for a UK bidding platform. If you are ready to move from billing reports to unit-level visibility, start with a free assessment from Koritsu AI.
Sources
The following sources informed this article and are worth consulting directly as you build your unit economics programme.
- A guide to cloud unit economics
- Introduction to Cloud Unit Economics
- Unit economics capability within the FinOps Framework (Microsoft)