FinOps Inform
Caught $7,500: Engineers' runbook for container cost monitoring
Practical runbook for engineering and FinOps teams to implement container cost monitoring: OpenCost allocation and a Koritsu case that caught a $7,500 spike.

Accurate container cost monitoring means joining cloud billing data with pod and node telemetry under a consistent allocation model, so every namespace, service and team has a defensible cost number attached to it. Get that right and you get per-service visibility, real-time anomaly alerts and a FinOps process that actually holds people accountable. Get it wrong and Kubernetes stays a black box where the bill arrives, nobody can explain it, and the same inefficiency repeats every month. This article walks through the data sources, the allocation formulas, a step-by-step implementation runbook, the governance layer that makes it stick, and a real case where continuous monitoring paid for itself in a single incident.
TL;DR:
- Accurate container cost monitoring requires combining cloud billing data with workload telemetry, especially labels, to produce reliable cost figures.
- The most common allocation formulas include CPU/memory weights, per-pod costs, and namespace-based methods, each with different accuracy and complexity trade-offs.
- Building a monitoring pipeline involves enabling billing exports, deploying telemetry, standardising labels, and setting anomaly alerts, with continuous verification against actual invoices.
- Open-source tools like OpenCost offer transparency but require operational effort, while vendor solutions like Datadog provide faster setup contingent on correct agent installation and network monitoring.
- Continuous monitoring with AI-driven analysis can catch cost anomalies early and help recover spend, especially when paired with proper labelling and ownership practices.
What data you need before you can monitor container costs properly
Container cost monitoring fails most often at the input stage, not the analysis stage. Teams try to build allocation models on incomplete data and then wonder why the numbers never reconcile with the actual AWS or GCP invoice.
Start with your cloud billing export. Amortised or unblended cost data from your provider's billing API gives you the ground truth: what you were actually charged, spread across the billing period rather than lumped into a single upfront payment for reserved capacity. The catch is that billing exports describe instances and services, not pods. A billing line tells you an EC2 instance cost £340 last month; it says nothing about which of the forty pods scheduled on that instance drove the spend. That's the gap the FinOps Foundation's guidance on calculating container costs exists to close, by combining billing data with workload-level telemetry rather than treating either as sufficient alone.
The workload side comes from Kubernetes metrics: pod-level CPU and memory requests versus actual usage, node utilisation, namespace, and whatever labels you've attached to resources. Without labels, none of this maps back to a service, a team, or a cost centre. This is where most container cost monitoring projects quietly stall.
Three categories of spend get missed constantly:
- Storage costs attached to persistent volumes, which rarely get tagged to the workload that uses them.
- Load balancer costs, often billed at the account level with no pod-level breakdown at all.
- Network and egress costs, which vendor documentation consistently flags as a blind spot. Datadog's container cost allocation docs note that without Cloud Network Monitoring enabled, data transfer costs end up dumped into a "not monitored" bucket that quietly inflates unallocated spend.
Get the account structure right too. If every environment (dev, staging, production) and every business unit shares one flat account, no amount of clever telemetry will let you separate their costs cleanly later.
Choosing an allocation model: the formulas that actually matter
Once you have billing and telemetry data flowing, you need a rule for turning raw numbers into a cost per namespace, service, or team. There's no universally correct formula. Each model trades accuracy against simplicity, and the trade-off you accept should match how your organisation actually uses the numbers.
- CPU/memory weighted split. The most common starting point splits shared node cost between pods based on their requested (or used) CPU and memory, often weighted roughly 60/40 in favour of CPU since compute tends to dominate node pricing. It's fast to implement and defensible for general-purpose workloads, but it breaks down for GPU or high-throughput I/O workloads where compute and memory aren't the real cost driver.
- Per-pod allocation. This gives the most granular view, attributing cost directly to each running pod based on its actual resource consumption. It's the model OpenCost uses natively, exposing allocation queries through Prometheus metrics and its own API rather than forcing teams to reverse-engineer pod costs from node-level billing.
- Namespace or label-based allocation. Rather than tracking every pod, you roll costs up to whatever unit maps to how the business thinks about spend, usually a namespace per team or a label per product feature. It's easier to report on but hides inefficiency inside the namespace if nobody drills further.
- Cluster-shared cost handling. Control plane costs, monitoring agents, and idle capacity sitting on nodes with no scheduled workload don't belong to any single pod. Decide upfront whether to spread these evenly across all workloads, allocate them proportionally by usage, or report "cluster idle" as its own line item, because leaving it unaddressed just makes your per-service numbers quietly wrong.
Committed-use discounts and multi-cloud pricing add a further complication. A reserved instance or savings plan changes the effective hourly rate of a node depending on how much of the commitment is used elsewhere in the account, which means the "cost" of a pod can shift week to week even if its resource usage doesn't move at all. Teams running the same workload across AWS, Azure, and GCP need separate allocation baselines per provider, since list prices, discount structures, and even how "vCPU" is billed differ enough that a single blended formula will mislead more than it clarifies.
Building the pipeline: instrument, enrich, compute, surface
Moving from no visibility to a working monitoring pipeline is a sequence, not a single project. Skip a step and the numbers you produce later will look plausible and be wrong.
Step 1: Enable amortised billing exports. Turn on your cloud provider's detailed billing API and configure it to export amortised or unblended cost data on a schedule you can automate against, typically daily.
Step 2: Deploy in-cluster telemetry. Install an exporter that reads Kubernetes metrics and joins them with billing data inside the cluster. OpenCost is the reference open-source option here, deployable via Helm and built specifically to expose allocation, asset, and cloud-cost queries through Prometheus metrics and its own API rather than requiring you to stitch this together manually.
Step 3: Standardise labels and ownership mapping. Every namespace and, ideally, every pod needs a label that maps to a cost owner, whether that's a team, a service, or a product line. Enforce this with policy tooling (OPA/Gatekeeper or your CI pipeline) rather than a wiki page, because unlabelled resources are where allocation reports quietly fail.
Step 4: Run allocation jobs and build daily aggregates. Compute allocated costs on a schedule and store daily rollups, not just live dashboards. Trend data is what lets you catch a slow creep in spend before it becomes a crisis.
Step 5: Set anomaly alerts and rehearse the response. Define thresholds for unexpected spikes per namespace or service, route them to the team that owns that workload, and actually run a drill so the on-call engineer knows what to check when the alert fires.
- Confirm agent instrumentation is enabled everywhere before trusting allocation totals; missing agents produce silent gaps, not errors.
- Reconcile your allocated total against the actual invoice weekly during rollout; discrepancies above a few percent usually mean a missing data source.
- Treat network monitoring as mandatory, not optional, given how consistently egress costs land in unallocated buckets without it.
Pro Tip: Run your allocation pipeline in parallel with your existing invoice reconciliation for at least one full billing cycle before you let anyone use the numbers for chargeback decisions. The first month almost always surfaces a data gap you didn't know you had.
If you want a deeper technical walkthrough of the rightsizing and autoscaling side of this, our Kubernetes cost optimisation runbook covers the engineering steps that typically follow once allocation is in place.
Open source, vendor platforms, or build it yourself?
The choice of tooling shapes how fast you get useful numbers and how much ongoing effort the pipeline demands, and none of the three routes is free of trade-offs.
Open-source tooling gives you full transparency into how a cost figure was calculated and no licensing bill attached to the monitoring layer itself. OpenCost is the clearest example: it's auditable, extensible, and increasingly capable of handling specialised cases like AI inference workloads, tracking cost per million tokens for vLLM-style deployments rather than forcing them through a generic compute formula. The trade-off is operational: you own deployment, upgrades, and the joins between billing exports and cluster metrics that a managed product would otherwise handle for you.
Vendor platforms bundle billing ingestion, in-cluster telemetry, and dashboards into a single product with support behind it, which shortens time-to-value considerably. The prerequisite work doesn't disappear, though. Datadog's own documentation is explicit that accurate allocation depends on installing agents correctly and enabling Cloud Network Monitoring so data transfer costs don't fall into an unmonitored bucket. Skip that step and a vendor tool produces the same blind spot an open-source pipeline would.
In-house dashboards built on your own data warehouse offer the tightest fit to internal reporting structures, cost centres, and terminology your finance team already uses. They're also the most maintenance-heavy option, since every provider pricing change or new label convention becomes a ticket for whoever owns the dashboard.
A hybrid model is common in practice: open-source telemetry collection feeding into either a vendor dashboard for finance-facing reporting or an internal dashboard for engineering-facing detail. When evaluating any option, score it against:
- Data completeness, does it cover storage, load balancers, and network, not just compute?
- Latency, are you looking at yesterday's numbers or last month's?
- Security and access control, who can see cost data broken down by team?
- Ownership, who fixes it when a label convention changes?
- Cost to implement, in engineering hours as much as licence fees.
Turning visibility into accountability: the FinOps layer
Cost data that nobody owns doesn't change behaviour. The FinOps Foundation's practitioner guidance is built around exactly this point: allocation only produces savings when it's tied to a named owner, a reporting cadence, and a defined metric, not left as a dashboard people glance at occasionally.
- Assign a cost owner per namespace or service. Every team lead should be able to name their monthly cloud spend without checking a spreadsheet someone else maintains.
- Set a reporting cadence. Daily automated alerts for anomalies, weekly reviews for engineering teams, and a monthly allocation report for finance and leadership; each audience needs a different frequency, not one dashboard for everyone.
- Track a small set of KPIs consistently: cost per service, idle capacity as a percentage of provisioned resources, and a cost efficiency ratio (useful spend against total spend). Three metrics tracked properly beat fifteen tracked loosely.
- Decide between showback and chargeback. Showback (reporting cost without billing it internally) changes behaviour more gently; chargeback (actually billing teams for their usage) tends to move faster but needs allocation accuracy solid enough to survive a dispute.
- Embed cost checks into sprint routines, not just quarterly reviews. A cost regression caught during a release review costs a Slack message; the same regression caught three months later costs a retroactive investigation nobody enjoys.
Mapping spend to individual microservices, as opposed to whole namespaces, tends to be the step that surfaces the most actionable detail, and it's worth doing deliberately rather than as an afterthought once the coarser reporting is already in place.
When continuous monitoring catches what a monthly review misses
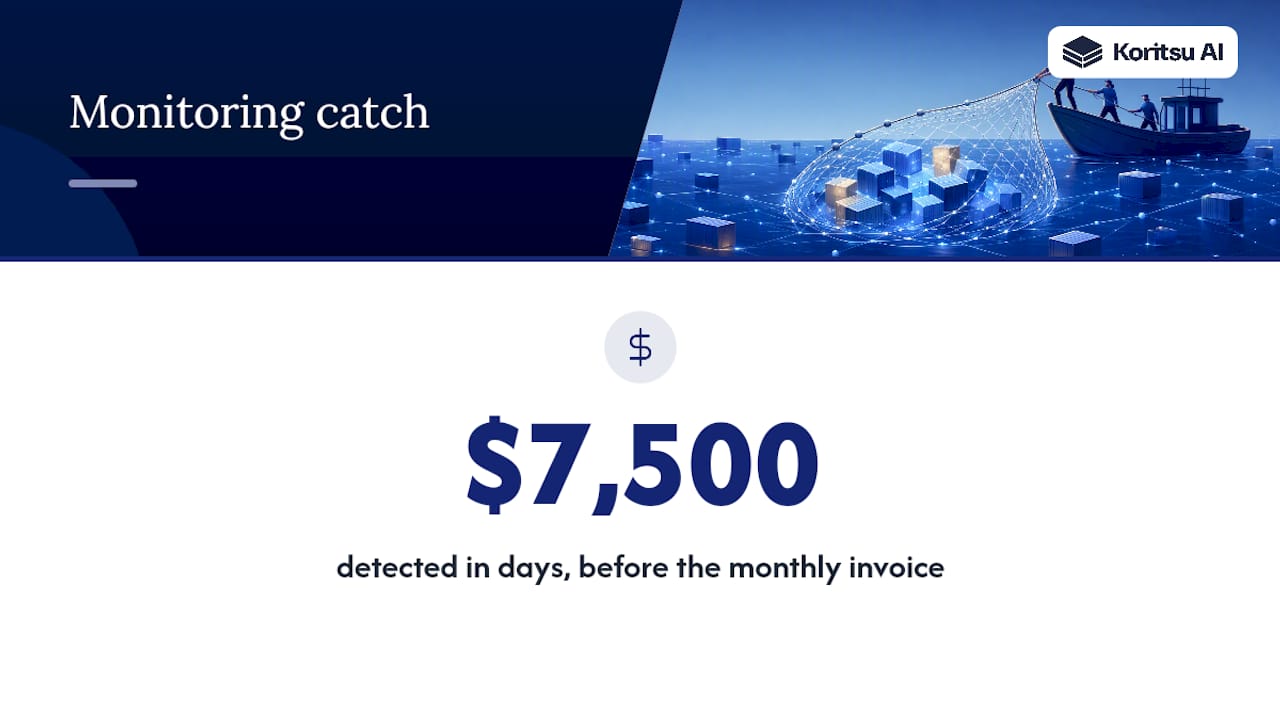
A useful test of any monitoring setup is whether it catches a problem before the invoice does. In one recent case, Koritsu AI's continuous monitoring flagged an unexpected $7,500 monthly cost increase during a routine account migration, well before it would have shown up in a standard monthly cost review.
The anomaly stemmed from a configuration carried over during the migration that kept a resource running when it should have scaled down. An AI monitoring agent surfaced the spike against historical baselines almost immediately; a FinOps specialist then verified the finding against the actual billing data and traced it to its root cause, rather than treating the alert as noise. The fix was straightforward once identified. The value was in catching it in days rather than a full billing cycle later.
The takeaways generalise beyond this one case. Set alert thresholds tight enough to catch percentage-level spikes, not just order-of-magnitude ones. Verify every alert against the real bill before acting, since telemetry occasionally disagrees with what you're actually charged. And treat account migrations and infrastructure changes as high-risk windows that deserve tighter monitoring, not looser, in the weeks immediately after.
Where to focus first if you're starting from zero
Most engineering leaders overinvest in dashboards and underinvest in labelling discipline, which is backwards. A perfect allocation model applied to unlabelled resources still produces a report full of "unknown" line items, and unknown spend is exactly what erodes trust in the whole exercise.

Prioritise high-variability workloads and anything currently unlabelled before chasing precision elsewhere. GPU and inference clusters, along with shared multi-tenant environments, tend to hide the fastest wins because nobody has ever cleanly separated their cost before. Measure ROI in three concrete numbers: pounds recovered from anomalies caught early, savings from rightsizing decisions the data made obvious, and the percentage reduction in spend sitting in an "unallocated" bucket month over month.
If your team can build and maintain the labelling discipline and the allocation pipeline internally, do it. If cost visibility keeps stalling because nobody has the bandwidth to own it properly, that's the signal worth flagging to bring in FinOps expertise rather than let the project drift for another quarter.
How Koritsu AI turns visibility into recovered spend
Most container cost monitoring projects stall not because the telemetry is hard to collect, but because nobody has time to act on what it shows once it's flowing. Koritsu AI closes that gap by pairing continuous, AI-driven analysis with FinOps specialists who verify findings against your actual bill and implement the fix, rather than leaving you with another dashboard to interpret.

Every engagement starts with a Savings Opportunity Report, which maps directly onto the data-gathering and allocation steps covered above: billing exports, workload telemetry, and label mapping, assessed against your actual infrastructure rather than a generic checklist. From there, ongoing monitoring through FinOps as a Service keeps watching for the kind of anomaly that caught the $7,500 monthly spike during that account migration, with Kori surfacing deviations and specialists confirming them before anyone acts. Koritsu AI's success-fee model means you pay based on savings actually verified against your bill, not for a dashboard you have to staff yourself. If you're running a high-variability workload with poor cost visibility right now, that's the sensible place to run a pilot first.
Sources
- Calculating Container Costs | FinOps Foundation
- OpenCost — open source cost monitoring for cloud native environments
- Container cost allocation | Datadog docs
- opencost/opencost
FAQ
What are the best container monitoring tools?
There's no single best tool. It depends on whether you want open-source control, vendor turnkey support, or a managed FinOps partner. OpenCost is the strongest open-source option for in-cluster allocation, while platforms like Datadog handle billing ingestion and dashboards for teams that want less operational overhead. Koritsu AI sits in a third category, combining continuous AI-driven analysis with hands-on specialists who verify and act on findings.
Can you provide a container shipping cost calculator?
Container cost monitoring in this context refers to cloud computing containers (Kubernetes workloads), not physical shipping containers, so a freight cost calculator isn't the right tool here. If you're looking to calculate Kubernetes or cloud container costs, the allocation formulas covered above, combining billing exports with pod and node telemetry, are the correct starting point.
How many CBMs are in a 40ft container?
This question relates to physical freight shipping, not cloud container infrastructure, which is the focus of this article. For cloud cost monitoring, the equivalent unit of measurement is compute cost per pod, namespace, or service rather than a volumetric measure.
Which platform is the best for container tracking?
For cloud container cost tracking specifically, the right platform depends on your team's operational capacity. Teams with strong internal engineering resource often start with OpenCost for transparent, in-cluster allocation, while teams wanting verified savings without building the pipeline themselves often work with a FinOps partner like Koritsu AI, whose pricing runs on a success-fee basis tied to actual results.
How do I know if my container costs are being allocated accurately?
Reconcile your allocated totals against your actual cloud invoice regularly, ideally weekly during rollout, and investigate any gap beyond a few percent. Persistent unallocated spend usually points to missing network monitoring, unlabelled storage, or load balancer costs sitting outside your allocation model, all common blind spots flagged in Datadog's own allocation documentation.