FinOps Inform
Cloud data transfer costs explained for engineers
Understand cloud data transfer costs to avoid surprises. Learn essential strategies to optimize your monthly transfer budget effectively.

Monthly transfer cost is the sum of every chargeable route’s gigabytes multiplied by its per-GB rate, minus free-tier allowances, plus any metered processing fees from NAT gateways or load balancers sitting in the path. Get that formula wrong and your forecast is wrong, no matter how carefully you tracked compute spend.
Three things to do this sprint:
- Map every route your workload uses, then flag which ones actually cross a billing boundary.
- Put a CDN or peering arrangement in front of any route where the same bytes get served repeatedly.
- Pull your NAT gateway and load balancer usage separately. These metered services often hide behind the transfer line and quietly inflate the bill.
Before anything else, check your billing console for two numbers: total monthly egress in GB, and your top five source regions by bytes sent.
Key Takeaways
Monthly cloud transfer cost equals the sum of each route’s gigabytes multiplied by its per-GB rate, minus free allowances, plus metered processing fees from NAT gateways and load balancers.
| Point | Details |
|---|---|
| Calculate by route, not total | Map every chargeable path separately before applying per-GB rates and free-tier deductions. |
| Source region sets the price | AWS, Azure, and Google Cloud all bill inter-region and internet egress against the source region. |
| Caching cuts costs fastest | CDN and cache-hit improvements typically deliver the highest savings for the least engineering effort. |
| Hidden fees hide in plain sight | NAT gateways, load balancers, and replication traffic often cost more than the egress line itself. |
| Koritsu AI finds the root cause | Continuous monitoring plus hands-on engineering support surfaces cross-AZ and NAT waste under a free assessment and success-fee model. |
What counts as cloud data transfer, and what doesn’t?
Ingress, the data flowing into a cloud provider’s network, is almost always free. Egress, data leaving that network, is where the meter runs. That asymmetry exists because providers want to make it easy to move data in and hard to move it back out, which is worth remembering the next time someone pitches you on a “free” migration.
Beyond that basic split, you need a shared vocabulary for the paths your traffic actually takes:
- Intra-AZ: traffic between resources in the same availability zone. Usually free.
- Inter-AZ: traffic crossing availability zones within a region. Often charged, sometimes at a lower rate than inter-region.
- Inter-region: traffic crossing regions entirely. This is where per-GB rates climb and pricing depends on the source region, not the destination.
- CDN/edge: traffic served from cache nodes near the end user rather than the origin. Usually cheaper, sometimes free between the CDN and its own network.
- Peering and private interconnect: dedicated links such as AWS Direct Connect, Azure ExpressRoute, or Google Cloud Interconnect, which bypass the public internet path entirely.
One detail that catches teams out: charges attach to the source region for inter-region and internet egress, as AWS’s own Cost and Usage Report documentation makes clear. A response payload can trigger its own billed flow, separate from the request that caused it, which is why chatty APIs sometimes cost more in transfer than in compute.
How do AWS, Azure, Google Cloud, and Cloudflare price transfer?
Every major provider follows the same skeleton: ingress free, egress metered, inter-AZ usually cheap or free, inter-region charged by source. The differences show up in the detail.
- AWS bills egress and inter-region transfer against the source region, with usage types in the CUR (like
DataTransfer-Out-Bytes) that map directly to billed routes. Amazon S3’s pricing page also aggregates the first 100 GB of transfer out free per month across most services, and transfer acceleration carries its own separate per-GB rate. - Microsoft Azure gives you the same first 100 GB/month free, then applies tiered internet egress rates that vary by source continent and whether you route through Microsoft’s global backbone or a local ISP, according to Azure’s bandwidth pricing page.
- Google Cloud (GCP) publishes granular VM-to-VM and inter-region tables, with Premium and Standard network tiers priced differently for the same route, per Google Cloud’s VPC network pricing documentation.
- Cloudflare takes a different stance entirely. Its egress fee primer explains the Bandwidth Alliance, a group of providers that waive or discount egress for shared customers, and points to Cloudflare R2 as a zero-egress object storage option.
- Redpanda, as a streaming platform you might run across any of these clouds, doesn’t set transfer pricing itself, but its broker-to-consumer traffic pattern is exactly the kind of cross-AZ flow that turns an ordinary Kafka-style deployment into a transfer cost problem.
Statistic to anchor your model: list internet egress commonly runs $0.05 to $0.12 per GB, while negotiated enterprise rates at high commitment volumes can fall to the low single cents per GB. That gap is the entire business case for talking to your account manager before you talk to your engineers.
How do you calculate monthly cloud transfer cost?
The formula is simpler than most billing dashboards make it feel:
- List every paid route your architecture uses (inter-AZ, inter-region, internet egress, CDN).
- Total the bytes per route for a full month, pulled from your CUR, Azure billing export, or Google Cloud billing export.
- Convert units carefully. Providers price in GB (10⁹ bytes) or GiB (2³⁰ bytes) inconsistently across services, so check the unit before you multiply.
- Apply the matching rate, including any free-tier allowance and volume-based tiering, exactly as practitioner guidance on egress modelling recommends.
- Add metered processing fees from NAT gateways, load balancers, or transit gateways sitting on the path.
- Validate against the actual invoice before you trust the model for forecasting.
Here’s a worked example for a multi-AZ streaming deployment (producers writing to brokers across three AZs, consumers reading back out):
- Cross-AZ replication traffic: 8 TB/month at $0.01/GB = $80
- Internet egress to external consumers: 3 TB/month at $0.09/GB = $270
- NAT gateway processing for outbound broker traffic: 1 TB at $0.045/GB = $45
- Total: $395/month, before any free-tier deduction
Pro Tip: Run the sensitivity check before you present the number. Model both directions, not just the current bill.
Which hidden charges get missed in transfer forecasts?
Most underestimated bills aren’t wrong about egress. They’re missing the services sitting in front of it. AWS’s own architecture guidance on data transfer costs flags exactly this pattern.
- NAT gateway processing: charged per GB processed, separate from the egress itself. Check the NAT gateway line item, not just the outbound transfer line.
- Load balancer bytes/LCU charges: application and network load balancers bill for capacity units that include data processed.
- VPC endpoints and Transit Gateway attachments: reduce some transfer costs but introduce their own hourly and per-GB charges.
- Cross-region replication: object storage replication and database read replicas generate inter-region copy traffic every time source data changes.
- Storage rewrite operations: migration tools like Google Cloud’s Storage Transfer Service add Class A/B operation charges on top of the transfer bytes themselves.
What’s the fastest way to cut cloud transfer costs?
Start with the changes that need the least engineering effort and deliver the biggest reduction, then work up the complexity ladder.
Low complexity, high impact:
- Put a CDN in front of anything served repeatedly. Cached bytes never touch your origin egress bill.
- Tune cache-hit ratios before you touch architecture. A jump from 60% to 85% hit rate can cut origin egress by more than half.
- Compress and trim payloads. Smaller responses mean fewer billed bytes on every single request.
Medium to high complexity:
- Move to peering or private interconnect (AWS Direct Connect, Azure ExpressRoute) for predictable high-volume flows between your data centre and cloud provider.
- Localise traffic by region so requests get served from the nearest deployment rather than crossing continents.
- Negotiate enterprise egress rates once volume commitments justify it. The gap between list price and negotiated price at scale is often the single largest lever available.
For streaming workloads specifically, partition placement matters more than most teams realise. If Redpanda or Kafka brokers and their consumers sit in different availability zones by accident of default configuration, every message read incurs inter-AZ charges twice over. Aligning consumer groups with broker AZ placement, or using rack-aware partition assignment, removes that cost without touching application code.
Pro Tip: Before and after every optimisation, capture the exact bytes-per-route figure, not just the total bill. Providers change unrelated line items constantly, and a shrinking invoice can mask a route that’s still growing. Where a provider participates in the Bandwidth Alliance, moving storage there can remove origin egress charges entirely for that leg.

What tools measure and forecast transfer costs?
Provider pricing calculators give you a starting estimate, but the real data lives in your billing exports: AWS’s Cost and Usage Report, Azure’s billing export, and Google Cloud’s billing export all break usage down by type, which is what lets you map bytes to routes accurately.
- Export bytes by usage type, then map each usage type to a transfer route.
- Apply the correct rate and tier to each bucket, then validate the total against the actual invoice.
- Set alerts on your top three or four routes so a sudden spike gets caught before the monthly bill does.
- Sample a week of traffic for any new workload before extrapolating to a full month. Weekly patterns rarely scale linearly.
How does Koritsu AI find hidden transfer costs?
Koritsu AI’s approach starts with continuous telemetry ingestion rather than a one-off audit, because transfer costs shift as traffic patterns and deployments change. Kori, our AI agent, maps bytes to routes automatically and flags anomalies as they appear, not weeks later when the invoice lands. Our engineers then work through the flagged findings with your team to confirm root cause and implement the fix.
Findings we surface repeatedly include:
- Cross-AZ replication traffic that grew silently as a service scaled out.
- NAT gateway overuse from outbound calls that could have routed through a VPC endpoint instead.
- Oversized origin payloads serving traffic that a CDN could have cached at a fraction of the cost.
Byte-route mapping consistently uncovers the same pattern: the transfer line item on the invoice is a symptom, and the actual cause sits two or three architectural decisions upstream, usually made months before anyone looked at the bill.
Engagements start with a free assessment, and we only take a share of the savings we actually verify against your billing.
Quick checklist for your next cloud cost meeting
Run through this with your infrastructure team before the next sprint planning session:
- Identify your top five egress routes by GB.
- Confirm whether egress bills at the source region for each route.
- Check NAT gateway and load balancer usage separately from transfer.
- Review CDN cache-hit rates for anything served repeatedly.
- Ask: “Which services route through NAT?” and “Do we have a documented cache strategy?”
Why does transfer cost discipline matter more than teams assume?
Surprise egress bills show up more often than they should, usually because nobody modelled the byte flow before shipping the architecture. Counting resources tells you almost nothing about cost. Counting routes does.
There’s a quieter risk here too: unexamined egress growth is a subtle form of vendor lock-in. The longer data accumulates in one provider’s region, the more expensive leaving becomes, and few teams notice until a migration is already on the table. Measure routes now, not just when you’re forced to.
Get a free cloud transfer cost assessment
Most teams that model their egress bill for the first time find at least one route costing far more than expected, usually a NAT gateway, a cross-AZ replication path, or a cache that never got tuned. Koritsu AI runs that analysis for you: continuous monitoring from our AI agent Kori, backed by FinOps engineers who turn the findings into fixes.

One UK bidding platform worked with Koritsu AI and cut cloud costs by 52% through a structured assessment and remediation process, transfer waste included. There’s no upfront cost to find out what your own architecture is leaking. Start with a free assessment on the Koritsu AI platform and see the routes actually driving your bill before your next invoice arrives.
Frequently asked questions
Is inbound data transfer to the cloud always free? Ingress is free across nearly all major providers, including AWS, Azure, and Google Cloud. The charge appears on the way out, which is why migration planning should focus on egress rather than the initial upload.
Why does my inter-region transfer cost more than expected? Inter-region charges bill against the source region, and rates vary significantly by continent and provider. Check which region initiated the transfer, not just where the data landed.
Does a CDN eliminate transfer costs entirely? No. A CDN reduces origin egress by serving cached content from edge locations, but you still pay for the traffic between your origin and the CDN on cache misses, plus any CDN-specific delivery fees.
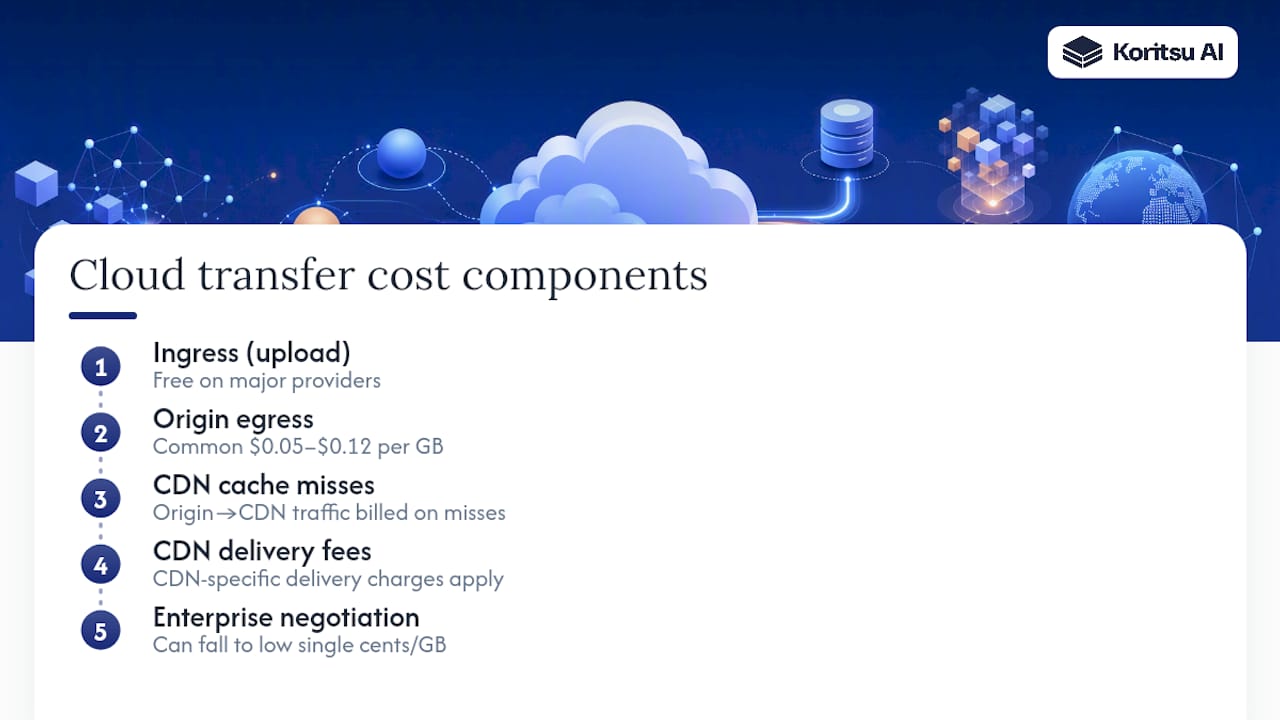
How much can enterprise negotiation actually save on egress? List egress commonly runs $0.05 to $0.12 per GB, while negotiated enterprise rates at high commitment volumes can fall to the low single cents per GB, making negotiation one of the highest-leverage cost actions available.
Sources
- Azure bandwidth pricing
- AWS Cost and Usage Report — data transfer usage types
- What are data egress fees?