FinOps Inform · Unit Economics
Cloud cost per transaction: a guide for CTOs
Discover what is cloud cost per transaction and how it can empower CTOs to link cloud spending to real product value effectively.

Cloud cost per transaction is defined as the total cloud infrastructure spend required to process a single unit of work, whether that unit is an API call, a payment, a search query, or a user login. For CTOs and engineering leaders, this metric is the clearest way to connect cloud expenditure to product value. Without it, you are managing a bill, not a business. The FinOps Foundation has made unit economics a central discipline precisely because unit cost metrics drive margin conversations that raw invoice totals never can. Tools like AWS Cost Explorer and platforms like Koritsu AI exist to make this calculation tractable at scale.
How to calculate cloud cost per transaction
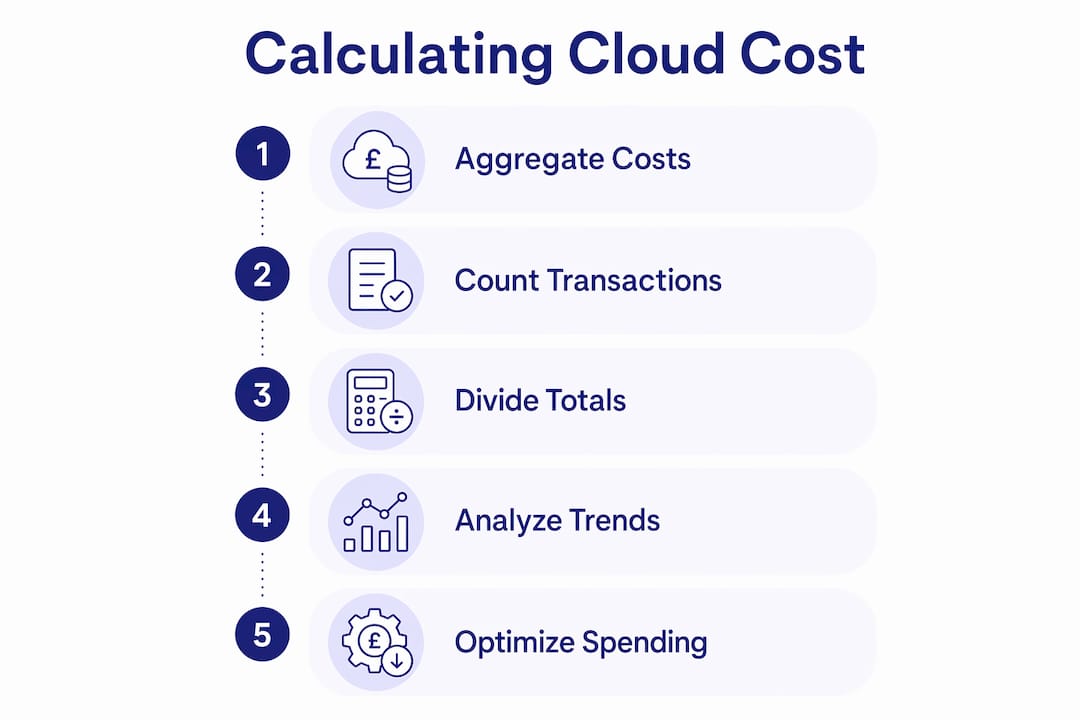
The calculation itself is straightforward. The difficulty is in the discipline required to do it consistently. Accurate calculation requires defining a consistent transaction, aggregating all cloud costs that service it, and dividing by the transaction volume measured over the same period. Each of those three steps contains real traps.
Follow this sequence to get a reliable number:
-
Define your transaction. A transaction must be a single, unambiguous unit of work your product delivers. For a payments platform, this is a completed charge event. For a search product, it is a query response. For a data pipeline, it is a processed record batch. The definition must be documented and agreed across engineering, product, and finance before any measurement begins.
-
Aggregate all contributing cloud costs. A single transaction rarely touches one service. It typically spans compute (EC2, Cloud Run, or Azure Functions), storage reads and writes, managed database queries, message queue operations, and outbound data transfer. Pull costs from every service in the workflow. AWS Cost Explorer, Google Cloud Billing, and Azure Cost Management all provide service-level breakdowns. Tag your resources by workload or product domain to make this aggregation reliable.
-
Obtain transaction volume from telemetry. Use your product analytics or observability platform, such as Datadog, Grafana, or your own event logs, to count transactions over the same time window as your cost data. Misaligned windows are one of the most common sources of error in this calculation.
-
Divide total allocated cost by transaction volume. The result is your cost per transaction for that period. Track it as a time series, not a point-in-time figure. A single number tells you little. A trend tells you whether your architecture is scaling efficiently or degrading.
-
Normalise for shared infrastructure. Not all costs map cleanly to a single transaction type. Shared compute clusters, common networking layers, and centralised logging services must be allocated via usage signals such as CPU share, memory consumption, or data egress proportion. Without this step, your per-transaction figure will be systematically understated.
Pro Tip: Set your cost aggregation and transaction count to refresh on the same cadence, daily or hourly, and store both as time-series metrics in your observability stack. This makes anomaly detection automatic rather than manual.
The AWS Cost Explorer API charges per paginated request, so engineering teams building automated cost reporting should design queries to minimise pagination. This is a small but real cost that compounds in high-frequency reporting pipelines.

How cloud pricing models affect transaction costs
Cloud providers charge per resource consumed rather than flat fees, which means your per-transaction cost is a composite of several independently metered dimensions. Understanding each dimension is the only way to identify which one is driving cost increases.
The table below summarises the primary pricing units and their relevance to transaction cost:
| Pricing dimension | Billing unit | Transaction cost impact |
|---|---|---|
| Compute | Per vCPU-hour or GB-hour | Scales with transaction processing time and concurrency |
| Storage | Per GB-month | Affects read/write-heavy transactions disproportionately |
| API calls | Per request or per million requests | Directly proportional to transaction volume |
| Data egress | Per GB transferred | Hidden cost driver in distributed or multi-region architectures |
| Cross-AZ traffic | Per GB | Significant in microservice architectures with inter-zone calls |
Metered resource pricing means that a single transaction can generate charges across all five dimensions simultaneously. A payment transaction on AWS might invoke a Lambda function (compute), read from DynamoDB (storage and API calls), call an external fraud-scoring service (egress), and write an audit record to S3 (storage). Each leg of that journey has its own billing unit.
Architectural patterns have a direct and often underestimated effect on per-transaction cost. A synchronous, monolithic architecture typically generates fewer cross-service calls per transaction than a loosely coupled microservice design. That does not make microservices the wrong choice, but it does mean the cost per transaction will be higher unless the architecture is deliberately optimised for it. Zero-egress architecture patterns are one concrete way to reduce this overhead.
Reserved instances and committed use discounts from AWS, Google Cloud, and Azure reduce the effective compute rate, which lowers per-transaction cost for predictable workloads. The saving is real, but it only applies to compute. Egress, API calls, and storage remain pay-as-you-go in most commitment models.
Pro Tip: When comparing API pricing models across providers or third-party services, always convert to a per-transaction cost using your actual call volume. A lower headline rate can be more expensive in practice if the billing unit does not align with your usage pattern.
What are the common pitfalls in measuring this metric?
Measurement errors in cloud cost per transaction are more common than most engineering teams realise, and they consistently produce either false confidence or unnecessary alarm. The following pitfalls account for the majority of misleading readings:
-
Ambiguous transaction definitions. Counting attempts rather than successes inflates transaction volume and artificially deflates cost per transaction. Counting only successes while including the cost of retries inflates cost per transaction. Retries and partial failures must be explicitly handled in your definition. Document whether a transaction means an attempt, a successful completion, or a logical business operation.
-
Inconsistent cost-accounting basis. AWS Cost Explorer offers both unblended and amortised cost views. Mixing them across reporting periods introduces drift. Accounting basis variations can affect cost per transaction accuracy by up to 10 to 20 percent. Choose one basis, apply it consistently, and handle credits systematically.
-
Shared cost allocation gaps. If your Kubernetes cluster runs multiple workloads and you attribute its full cost to one transaction type, every other transaction type appears artificially cheap. Allocate shared costs using resource usage signals. CPU share is the most common proxy for compute; egress bytes work well for networking.
-
Low-volume distortion. During off-peak periods, fixed overheads such as always-on databases or idle compute reservations are spread across far fewer transactions. This produces cost-per-transaction spikes that look alarming but reflect utilisation patterns, not architectural inefficiency. Segment your analysis by traffic tier to avoid misdiagnosis.
-
Tagging gaps. Untagged resources cannot be attributed to a workload. In large AWS or Azure environments, common API cost mistakes often trace back to incomplete tagging strategies that leave significant spend unallocated. Treat tagging coverage as a first-class engineering concern, not a housekeeping task.
A practical diagnostic: if your cost per transaction spikes sharply without a corresponding change in architecture or traffic, check your cost-accounting basis first, then your transaction denominator, then your tagging coverage. Most spikes resolve at one of those three points.
How to use cost per transaction for FinOps and optimisation
The metric only creates value when it changes behaviour. A number sitting in a dashboard that nobody acts on is not a FinOps practice. It is a reporting exercise. The following applications turn cost per transaction into a genuine engineering and business tool:
-
Integrate it into SLOs and error budgets. Treat cost per transaction as a service-level indicator alongside latency and error rate. When a deployment causes cost per transaction to rise by more than a defined threshold, that is a signal worth the same attention as a latency regression.
-
Surface outliers by workload. Drilling from per-customer to per-API-call granularity identifies which specific endpoints or functions are disproportionately expensive. A single high-cost API call that accounts for 40 percent of transaction spend is a refactoring target, not a billing line item.
-
Drive cross-functional cost conversations. Unit cost metrics shift conversations from "the cloud bill is too high" to "this feature costs £0.003 per transaction and we process 50 million per month." Product managers can make informed trade-offs. Finance teams can model margins accurately. Engineering teams have a concrete target.
-
Use it for forecasting. If your cost per transaction is stable, revenue growth forecasts translate directly into cloud cost forecasts. If it is trending upward, you have an early warning that architecture or pricing changes are needed before the bill becomes a problem.
-
Connect spend to business outcomes. The alignment of cloud costs with product KPIs is the defining characteristic of mature FinOps practice. Cost per transaction is the most direct mechanism for achieving that alignment.
Pro Tip: Set automated alerts for cost-per-transaction anomalies using your observability platform. A 20 percent week-on-week increase that is not explained by traffic growth is worth investigating before it compounds. Stable or improving trends confirm that optimisation work is delivering.
Key takeaways
Cloud cost per transaction is the most direct metric for connecting cloud infrastructure spend to product value, and it requires consistent definitions, accurate cost allocation, and time-series tracking to be reliable.
| Point | Details |
|---|---|
| Define transactions precisely | Document whether a transaction is an attempt, success, or logical operation before measuring anything. |
| Aggregate all cost dimensions | Include compute, storage, egress, API calls, and cross-AZ traffic for every service in the workflow. |
| Use consistent cost-accounting | Apply either amortised or unblended costs throughout; mixing bases distorts trends by up to 20 percent. |
| Allocate shared costs fairly | Use CPU, memory, or egress signals to apportion shared infrastructure costs across transaction types. |
| Embed the metric in FinOps practice | Integrate cost per transaction into SLOs, forecasting, and cross-functional reviews to drive real decisions. |
The metric that changes how engineering teams think
The most significant thing I have observed working with engineering teams on cloud cost analysis is not a technical problem. It is a framing problem. Teams that track invoice totals argue about budgets. Teams that track cost per transaction argue about architecture. The second conversation is the one that actually improves the product.
Defining a transaction unit is harder than it sounds. I have seen teams spend three weeks debating whether a failed payment attempt counts as a transaction for cost purposes. That debate is worth having. The answer shapes every downstream decision about retry logic, error handling, and infrastructure sizing. The teams that resolve it early move faster on everything else.
The evolution of cloud pricing models in 2026 makes this more complex, not less. Serverless pricing, per-request billing for managed AI services, and variable egress costs across multi-region deployments all add dimensions to the calculation. The FinOps principles that worked well for EC2-centric architectures need extending to cover these newer patterns. The teams I see doing this well are the ones treating cost per transaction as a first-class engineering KPI, not a finance team concern.
My practical advice for CTOs: start with one transaction type, get the calculation right for that, and then expand. Trying to instrument everything at once produces noise. One well-defined, consistently measured unit cost metric is worth more than ten poorly defined ones.
See your cloud costs at transaction level
If you are ready to move beyond invoice totals and understand exactly what each transaction costs your business, Koritsu AI provides the analysis to get there.
Koritsu AI combines continuous AI-driven cloud cost analysis with hands-on engineering expertise. Our platform surfaces transaction-level cost inefficiencies buried in your architecture, not just your pricing tier. One UK bidding platform achieved a 52 percent cost reduction by addressing the structural inefficiencies Koritsu identified. You start with a free assessment, and we only charge when we deliver measurable savings. Start with a free cloud assessment and see where your per-transaction costs are hiding.
FAQ
What is cloud cost per transaction?
Cloud cost per transaction is the total cloud infrastructure spend divided by the number of transactions processed in the same period. It translates raw cloud expenditure into a unit cost tied directly to product delivery.
How do I calculate cost per transaction on AWS?
Aggregate costs from all AWS services involved in your transaction workflow using AWS Cost Explorer, then divide by transaction volume from your telemetry or analytics platform over the same time window. Use amortised costs for consistency across periods.
What affects cloud cost per transaction most?
Compute duration, data egress, cross-availability-zone traffic, and API call volume are the primary drivers. Architectural patterns, such as the number of microservice hops per transaction, have a significant and often underestimated effect on the total.
Why does cost per transaction spike during low-traffic periods?
Fixed overheads such as always-on databases and idle reserved compute are spread across fewer transactions during off-peak periods, inflating the per-unit figure. This reflects utilisation patterns rather than architectural inefficiency and should be analysed separately from peak-traffic data.
What is the difference between unblended and amortised costs for this metric?
Unblended costs reflect the actual rate charged for each resource at the time of use. Amortised costs spread reservation and savings plan fees evenly across the commitment period. Mixing the two across reporting periods can distort cost per transaction trends by up to 10 to 20 percent.