FinOps Inform
Cut Cloud Waste in 90 Days: UK Benchmarks for CIOs, CFOs
Practical UK cloud benchmarks and a repeatable per-revenue normalisation method for CIOs and CFOs, with sector breakouts, storage and AI cost footing.

For many UK mid-market and enterprise firms, public cloud typically consumes a roughly mid-to-high single-digit to low double-digit percentage of revenue, with the range widening further out at the margins. Benchmark yourself by using per-revenue and per-workload normalisations, not list prices, and if you sit above the 75th percentile, prioritise a FinOps review before your next renewal.
TL;DR:
- Sector-specific benchmarks are essential, as finance and technology companies typically have higher cloud bills relative to revenue than professional services or public sector organizations.
- AI projects significantly increase cloud costs, especially storage fees for data and models, which can quietly accumulate beyond initial compute spikes.
- Applying normalization techniques, like tagging episodic workloads separately, helps maintain accurate cost benchmarks and avoid skewed metrics.
- Quick savings often come from rightsizing compute instances, implementing storage tiering, and adopting continuous FinOps practices through structured reviews.
1. UK headline benchmarks: percentiles, tiers and data provenance
Most UK organisations we speak with want one number, but cloud spend behaves like a distribution, not a constant. A typical mid-market firm sits in the middle of the range, enterprise buyers with heavy compute or AI workloads sit higher, and smaller operations with lighter infrastructure sit lower. The useful exercise is not finding the "right" percentage but working out where you fall and why.
The UK public cloud market itself is substantial: Statista's market tracking places UK public cloud revenue in the multi-billion-dollar range, which gives scale to the spend figures organisations report individually. Government spending adds further weight: the public sector now spends more than £1 billion a year on cloud solutions. This figure is large enough that central bodies have built dedicated tooling just to track it.
| Source | Metric | Date |
|---|---|---|
| Gov | UK public sector cloud spend, over £1 billion annually | June 2025 |
| Statista | UK public cloud market revenue, multi-billion-dollar scale | Ongoing tracking |
Samples behind most industry benchmarks skew towards larger, more digitally mature organisations, partly because they are easier to survey and partly because AI and large-scale workloads have pushed their bills up faster than smaller peers. If your own spend sits well above a sector median, treat that as a prompt to check allocation and waste before assuming it reflects genuine business need.
2. Sector and public sector breakout: finance, tech and G-Cloud
Benchmarking against a market-wide average misleads almost every reader, because sector intensity varies enormously. A few patterns hold consistently across UK organisations we encounter:
- Finance firms typically run higher cloud bills relative to revenue, driven by compute-heavy risk modelling and regulatory data retention requirements.
- Software and technology companies also skew high, since their product is often the infrastructure itself rather than a cost centre supporting another business.
- Professional services firms tend to sit lower, with cloud spend concentrated in productivity tools and lighter workloads rather than custom compute.
- The public sector spends at genuine scale, over £1 billion annually, and is now centralising cloud cost visibility through G-Cloud and GDS to improve negotiation and procurement across departments.
The practical takeaway: pick peers from your own sector when you benchmark, not a blended market figure. A fintech comparing itself to a professional services firm will draw the wrong conclusion every time.
3. Primary cost drivers: AI, storage and licences
AI projects have become one of the clearest upward pressures on UK cloud bills, and they distort simple benchmarks if you let them. Training and inference workloads consume compute in short, intense bursts, then leave behind large volumes of stored data and model artefacts that keep accruing charges long after the project ends. Surveys of UK IT decision-makers point to a majority of AI budgets flowing straight into data, storage and compute, which means storage fees deserve their own line item rather than being buried in general infrastructure spend.
Persistent storage fees remain one of the most commonly cited causes of cloud overspend in UK organisations surveyed about AI infrastructure. That matters because storage costs rarely show up as dramatically as compute spikes, yet they compound quietly month after month.
Beyond AI, the recurring waste categories are familiar:
- Idle compute left running outside business hours or after a project winds down.
- Storage tiers that never get moved to cheaper cold storage as data ages.
- Licence duplication across teams that provisioned the same software independently.
- Egress charges from moving data between clouds or regions more often than necessary.
4. How to apply benchmarks: metrics, normalisation and a worked example
A single benchmark number is only useful once you have chosen the right lens. Four metrics cover most UK organisations:
- Cloud spend as a percentage of revenue, the headline figure most boards ask for.
- Cloud spend per full-time employee, useful for comparing operational efficiency across departments or divisions.
- Cloud spend per active user, suited to SaaS and consumer platforms with variable usage.
- Cloud spend per core or vCPU-hour, the most granular and the most useful for engineering teams.
Normalisation matters as much as the metric itself. If you ran a large AI training job this quarter, strip it out or report it as a separate line, otherwise it will make your "steady state" infrastructure look far more expensive than it actually is.
Pro Tip: Keep a running "AI and episodic workloads" tag in your billing exports so one-off spikes never get averaged into your baseline run rate.
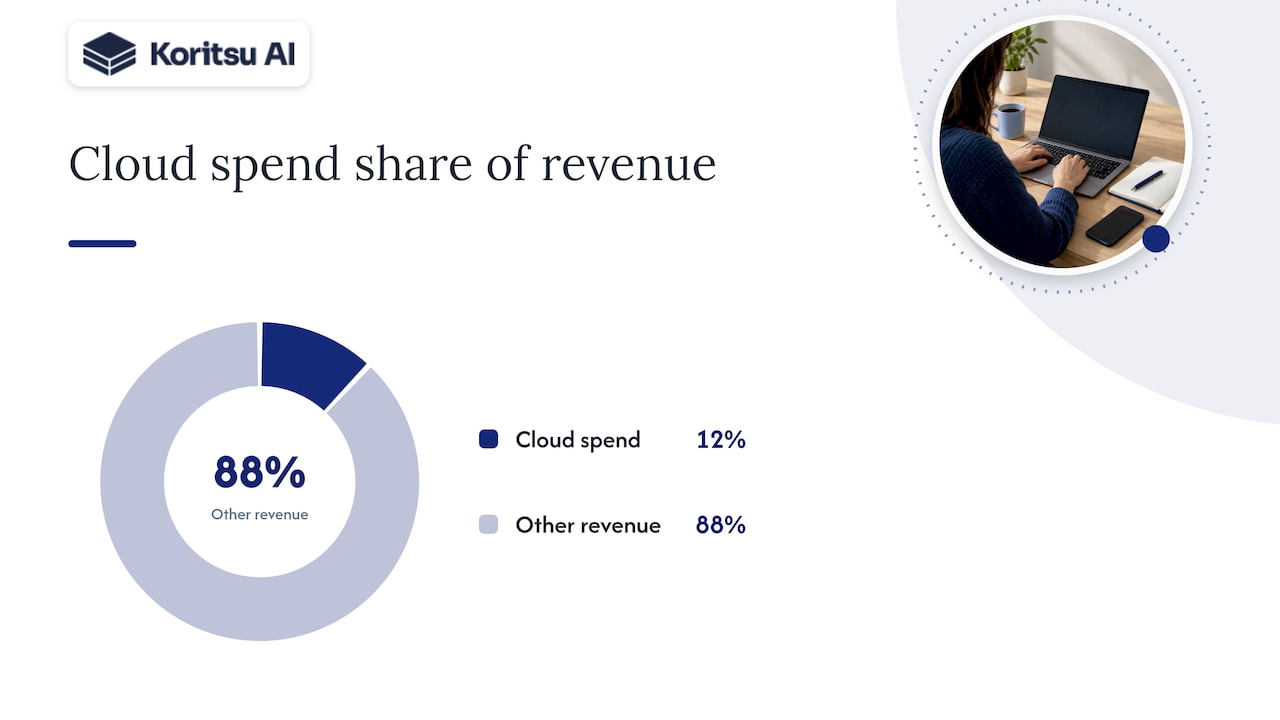
Say a firm with £50 million in annual revenue spends £6 million a year on cloud. Structuring canonical billing exports this way, as we cover in our guide to engineering-grade cost reporting, makes this kind of normalisation repeatable rather than a one-off spreadsheet exercise.
5. High-impact levers to move from benchmark to best practice
Knowing where you sit is only half the job. The levers that move the number fall into two groups, and the technical ones usually deliver more than the commercial ones.
- Rightsizing oversized compute instances, often the single largest quick win on a first pass.
- Reservations and savings plans for predictable, steady-state workloads rather than on-demand pricing throughout.
- Storage tiering and lifecycle policies that automatically age data into cheaper tiers.
- Licence rationalisation across teams that have unknowingly duplicated the same tools.
- Contract renegotiation once usage patterns are clear enough to commit with confidence.
On the organisational side, FinOps adoption, chargeback or showback models, and continuous billing verification turn one-off savings into a sustained discipline rather than an annual clean-up.
Pro Tip: A focused 90-day FinOps sprint, with clear ownership and weekly billing checks, typically surfaces savings fast enough to self-fund the next phase of work, a pattern we walk through in our 90-day DevOps cost management guide.
6. Methodology and primary data sources
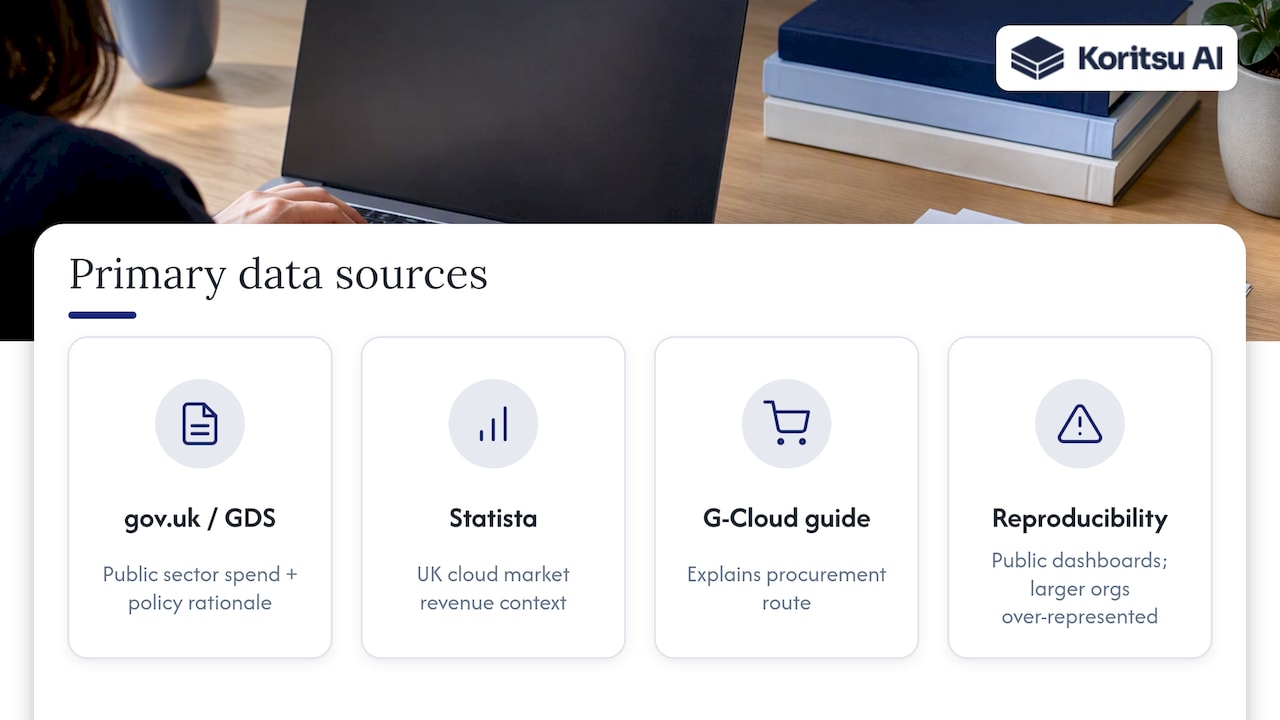
The figures in this article draw on a small set of primary sources rather than a single survey. gov.uk and the GDS technology blog supply the public sector spend total and the rationale behind centralised cost tooling. Statista's UK cloud computing topic page supplies market-level revenue context, and the G-Cloud buyers' guide explains the procurement route behind much of that public spend.
Readers can reproduce and refresh these figures directly from the public G-Cloud dashboards and the Statista topic page, bearing in mind that larger, more digitally mature organisations remain over-represented in most industry samples.
7. Our perspective: where engineering change actually saves money
Across the UK customers we work with, the largest verified savings rarely come from buying a bigger discount. They come from fixing how infrastructure was architected in the first place: over-provisioned databases, duplicated environments, telemetry nobody reviews. A commitment discount caps your downside; it does not fix an inefficient build.
An in-house FinOps sprint works well when you already have engineering capacity to spare and clear billing data. When neither exists, bringing in outside execution help, as outlined in our approach to verifying savings against the bill, tends to move faster.
A practical next step: our free assessment and Savings Opportunity Report
We start every engagement with a free assessment that produces a Savings Opportunity Report, a billing-level breakdown of where money is being lost, verified against your actual invoices rather than estimated from list prices. We only take a share of the savings we actually find, so there is no upfront cost to find out where you stand.

This suits engineering-led organisations with material public cloud spend on AWS, Azure or GCP best, particularly teams that suspect waste but lack the time to chase it down themselves.
- The free assessment maps your spend against sector benchmarks and flags anomalies.
- The Savings Opportunity Report translates findings into prioritised, costed actions.
- Ongoing support is available through our FinOps as a Service plans, Monitor, Advisor, Embedded and Premium, once initial savings are verified.
| Offering | What it delivers |
|---|---|
| Savings Opportunity Report | Billing-level diagnostic of waste and savings opportunities |
| FinOps as a Service | Ongoing monitoring and hands-on FinOps support across four plan tiers |
Pricing for the success fee model is available on request, and you can see the full FinOps platform at Koritsu AI.
FAQ
What percentage of revenue should UK cloud spend be?
Use your own sector as the comparison point rather than a blended market average.
Why is public sector cloud spend so high in the UK?
The UK public sector spends more than £1 billion annually on cloud services, reflecting the scale of government digital infrastructure across departments. Central bodies are now consolidating cost visibility through G-Cloud and GDS tooling to improve negotiation and reduce duplicated spend.
How does AI change cloud spend benchmarks?
AI training and inference workloads create short, intense compute spikes followed by long-running storage costs that can distort steady-state benchmarks if left unseparated. Tagging AI and episodic workloads separately in billing exports keeps your baseline comparison accurate year on year.
What is the fastest way to reduce cloud waste?
Rightsizing oversized compute instances and applying storage lifecycle policies typically deliver the quickest measurable reductions, followed by licence rationalisation and contract renegotiation once usage patterns are clear. A structured 90-day FinOps sprint with weekly billing checks is a practical way to surface these savings systematically.
How does Koritsu's pricing work?
We charge a success fee, taking a share of the savings we verify against your actual billing, with no upfront cost for the initial assessment. Ongoing support is available afterwards through our tiered FinOps as a Service plans, with full pricing details available on request at our pricing page.
Sources
For readers who want the underlying datasets, gov.uk and the GDS technology blog cover public sector cloud spend and G-Cloud centralisation, Statista tracks UK market-level cloud revenue, and the G-Cloud buyers' guide explains public procurement routes. Finance and infrastructure teams embedding these figures into reporting processes may also find value in reviewing how outsourced finance functions handle cost allocation across jurisdictions.
- Improving public sector spending with the cloud cost data solution
- Cloud computing in the United Kingdom - statistics & facts