FinOps Inform
Cloud Cost per Customer: 4 Decisions That Reveal SaaS Unit Economics
Calculate cloud cost per customer by linking billing data with app telemetry, allocating shared spend, and testing the formula with a monthly SaaS example.

Cloud cost per customer equals your total cloud spend divided by your chosen customer unit, whether that is paying accounts, monthly active users or seats. A blind average across the whole base hides more than it reveals. Segmenting by tier or usage pattern turns a single flat number into a decision-making tool.
TL;DR:
- Choose the denominator that matches the business model: paying accounts track subscription margin, monthly active users track engagement efficiency, and seats or API calls suit usage based pricing.
- Start with cloud infrastructure costs, then add software or labor only after tagging and telemetry are reliable; separate direct, shared, and fixed costs.
- Tags work for dedicated tenant resources but mislead on pooled databases; use weighted CPU, memory, and request metrics when allocation affects pricing or board reporting.
- Segment costs by tier and usage band, since heavy API users can distort the blended average and migration or onboarding can temporarily inflate individual accounts.
- Check feature flags and oversized development environments first; commit to reserved capacity only after usage stabilizes, and verify savings against invoices monthly.
How to calculate cloud cost per customer step by step
Getting a trustworthy figure means working through four decisions in order, not jumping straight to division.
- Choose your denominator. Paying customers suit subscription businesses, monthly active users suit consumption products, and seats or API calls suit usage-based pricing. Each choice changes what the number tells you: cost per paying customer tracks margin, cost per MAU tracks engagement efficiency.
- Choose your numerator. Decide whether you are measuring cloud infrastructure only, cloud plus third-party SaaS tools, or cloud plus a share of engineering labour. Cloud-only is the simplest starting point and the one most teams should use first, according to FinOps unit economics guidance, which recommends expanding scope only once tagging and telemetry are solid.
- Segregate the bill. Split spend into direct costs tied to one tenant, shared costs pooled across many tenants, and fixed costs that do not move with customer count at all (platform licences, a core database cluster).
- Compute segmented numbers. Run the formula separately for each pricing tier or usage band rather than once for the whole base, so a handful of heavy users does not distort the picture for everyone else.
This sequence is what separates a number you can act on from a vanity metric that looks precise but means little.
Which allocation method fits your cost structure
Once costs are segregated, shared and pooled spend still needs a defensible way to land on individual customers. Three methods cover most situations.
- Single-metric proportional allocation divides shared costs using one signal, such as API calls or database transactions. It is quick to set up and easy to explain to a finance partner, but it assumes that signal tracks resource consumption evenly, which rarely holds once customers differ in behaviour.
- Multi-metric weighted allocation blends several signals, typically CPU, memory and request volume, into one weighted formula. AWS's worked proof-of-concept for a Kubernetes environment maps app-level metrics to underlying resource costs this way, and it tends to produce figures that hold up under scrutiny.
- Tag-driven attribution works well when resources are genuinely one tenant per instance, but loses accuracy fast on pooled infrastructure like shared databases or GPU clusters, where no single tag captures who used what.
Coarse single-metric estimates are fine for an early directional view. Once a number starts driving pricing or board reporting, the investment in weighted or telemetry-based allocation pays for itself.
Pro Tip: Start with whichever metric you already collect reliably, then add a second signal only once the first one is in production and trusted.
What data you need to build a reliable pipeline
A per-customer number is only as good as the data feeding it, and most teams underestimate how much plumbing that requires.
- Billing exports: Cost and Usage Reports from AWS, GCP or Azure are the authoritative source for what was actually spent, down to the resource and tag level.
- Application telemetry: API call counts, CPU and memory by tenant or namespace, storage per tenant, and egress volume, all exported to a store you control rather than left in provider dashboards.
- Tags: useful for dedicated, single-tenant resources but insufficient on their own for pooled infrastructure, where practitioners increasingly build custom telemetry pipelines to map real usage to cost rather than relying on static tag proportions.
- A join layer: a scheduled process that pulls billing data, pulls app metrics, joins them on tenant or namespace, and runs the allocation job.
Our guidance on canonical cost exports covers the export side of this in more detail, and teams building the telemetry layer from scratch often bring in an operational intelligence partner such as Opsphere to handle anomaly detection and cross-source metric ingestion rather than building it in-house.
A worked example: splitting a monthly bill by customer
Take a SaaS platform with a monthly cloud bill of £27,000, of which £16,000 is a shared compute cluster.
The shared compute cluster serves all 10,000 monthly active users, so it needs apportioning rather than a flat split. Using a weight set of 50% API calls, 37.5% CPU and 12.5% memory, as recommended in the AWS tenant-costing proof of concept, an average customer's share of that £16,000 compute line comes out close to the base rate, while a handful of heavy API users pull a disproportionate share.
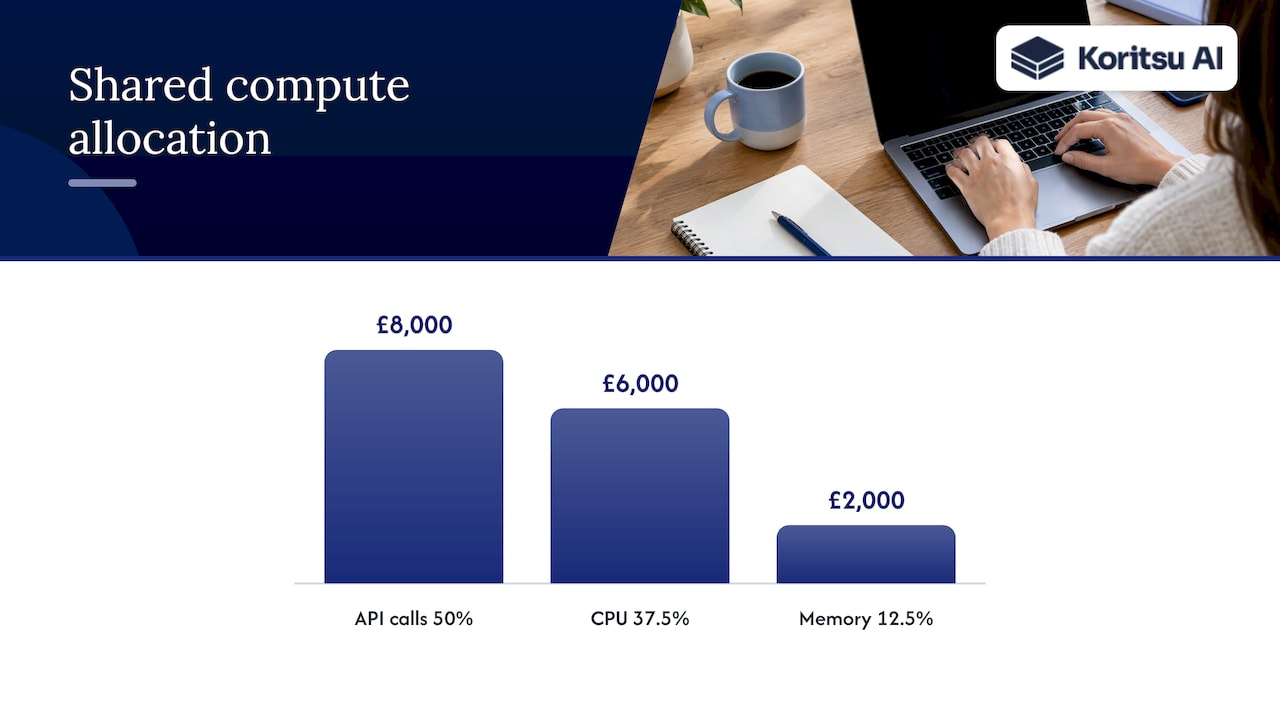
Dividing the full £27,000 by 10,000 users gives a baseline of £2.70 per user, following the same total spend ÷ users method shown in the cloud cost per user framework.
That averaged figure of £2.70 per user is the number to present, but only alongside the segmented view, because a small set of outlier accounts almost always sits well above it.
When to act: cost thresholds and where to look first
SaaS B2B teams at growth stage typically see cloud cost per user in a range from a few dollars to around ten dollars, with the figure trending down as scale brings efficiencies. Treat a number climbing against that band, rather than falling, as the signal to investigate.
- Fix high-impact, low-effort issues first: misconfigured feature flags left running in production, oversized development environments, and observability tooling that scales cost faster than usage.
- Only buy reserved capacity or savings plans once usage is stable, since committing early on a shifting workload locks in the inefficiency rather than removing it.
- Verify every claimed saving against the actual bill, not against a forecast, and report the trend monthly rather than quarterly so drift gets caught early.
Pro Tip: Check feature-flag and staging-environment spend before touching your production architecture, since those two categories account for a disproportionate share of easily recoverable inefficiency. Our notes on feature flag cost impact walk through a concrete case.
How we turn continuous analysis into verified savings
An AI agent can run continuously against live billing and usage data, surfacing inefficiencies that a one-off audit misses, the kind buried in how a service was architected rather than in which discount tier it sits on. A typical engagement starts with an initial assessment, moves to quick wins, then into implementation support from specialists, with every saving verified against the actual bill rather than a projection.
Success-fee alignment means a fee is taken only on a share of savings shown, line by line, on the invoice.
Multi-cloud and hybrid setups add their own friction
Running workloads across AWS, GCP and Azure, or mixing cloud with on-premises infrastructure, makes per-customer costing noticeably harder. Each provider formats its billing data differently, uses different units for the same resource type, and tags inconsistently even within the same organisation.
The practical fix is to normalise everything into one internal cost model before allocation, rather than trying to compute a per-customer figure separately in each provider's console and add the results together. A customer whose workload spans two clouds, perhaps compute on one provider and storage on another, needs their consumption stitched together at the tenant level first.
Hybrid environments add a further wrinkle: on-premises hardware depreciates and gets amortised differently from a cloud bill that arrives monthly. Treating a fixed on-premises cost as if it behaved like elastic cloud spend produces a per-customer number that swings for reasons unrelated to actual usage.
Teams in this position generally need a dedicated join layer that can ingest Cost and Usage Reports from each provider alongside on-premises utilisation data, which is exactly the kind of cross-source ingestion an operational intelligence layer like Opsphere is built to handle.
Customer behaviour drives most of the variance you'll see
A single average cost-per-customer figure assumes customers behave similarly, and they rarely do. A small group of power users running high API volumes, large data exports or heavy background processing jobs can account for a share of infrastructure spend far out of proportion to their share of revenue.
FinOps practitioners describe this as the simple average trap: true unit economics requires attributing cost to consumption patterns, not headcount. A plan with 1,000 identically priced customers can easily have ten of them driving disproportionate compute cost.
This matters most at renewal and pricing decisions. A customer whose usage has crept up without a corresponding price increase is quietly eroding margin, and that erosion is invisible in a blended average. Segmented reporting, by tier and by usage band, is what surfaces it. Seasonal and lifecycle effects matter too: a customer in an onboarding push or a data migration will show an inflated short-term cost that should not be mistaken for their steady-state footprint.
Connecting cost per customer to lifetime value
Cost per customer only becomes a genuinely useful metric once it sits next to the revenue and retention numbers finance already tracks. A customer with a high infrastructure cost but strong lifetime value may still be entirely worth serving; a customer with a low cost but poor retention may not be.
The practical move is to calculate a gross margin per customer or per tier by subtracting cloud cost per customer from average revenue per customer, then track how that margin trends as the account ages. Customers whose cost grows faster than their revenue over time are the ones worth a pricing conversation before renewal, not after.
This join also exposes which acquisition channels or customer segments bring in accounts that are structurally expensive to serve, information that a revenue-only view of customer lifetime value simply cannot show on its own.
Where accuracy breaks down in practice
Apportioning shared costs is never exact, and a few failure modes show up repeatedly.
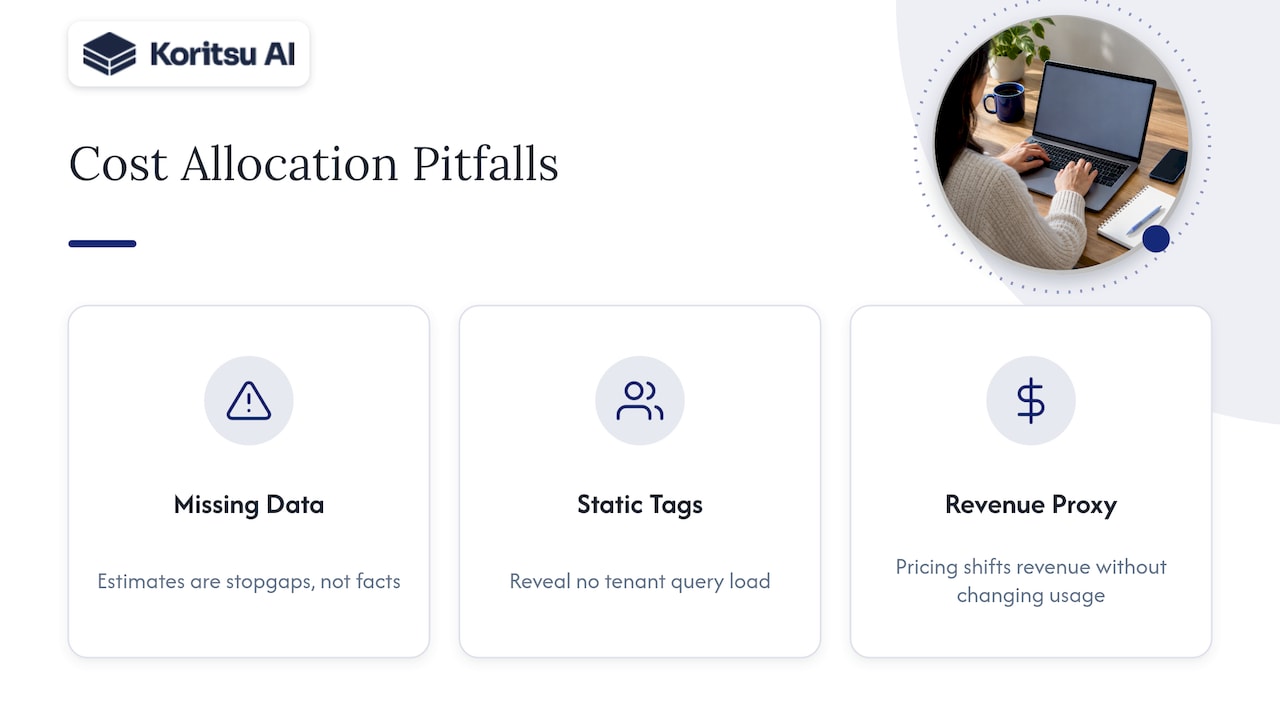
Missing telemetry is the most common one. Unit-economics projects are frequently challenged by gaps in raw usage data, forcing teams to fall back on correlated estimates rather than direct measurement, which is workable as a stopgap but should be labelled as an estimate, not treated as fact.
Static tags on dynamic, pooled infrastructure are another. A tag applied once to a shared database cluster tells you nothing about which tenant drove which query load that month, and treating tag-based splits as precise on pooled resources is a common source of quietly wrong numbers.
Using revenue as a proxy for usage is a third pitfall. FinOps guidance recommends business activity metrics such as tickets processed or API calls over revenue, because pricing changes distort revenue independently of actual consumption, which then distorts any cost-per-unit figure built on top of it.
How provider pricing models change the per-customer number
The same workload can produce different per-customer costs purely based on which pricing model it runs under. On-demand pricing gives the clearest, most directly attributable cost per unit of usage, which makes it the easiest to allocate accurately, but it is also the most expensive baseline.
Reserved instances and savings plans lower the headline bill, but they introduce a commitment that doesn't scale linearly with customer count, so the discount has to be apportioned across customers rather than attributed to any one of them. Spot or preemptible pricing adds volatility that can make a customer's allocated cost swing month to month for reasons entirely unrelated to their own usage.
Granular unit-economics programmes that track cost per compute core, storage unit and usage pattern over a sustained period are the ones best placed to separate a genuine usage-driven cost change from one caused purely by a shift in discount structure.
Automating allocation so the metric scales with you
A per-customer cost calculation done manually in a spreadsheet works for a handful of accounts and breaks down well before a few hundred. A practical pipeline runs on a schedule: export billing via Cost and Usage Reports, push application metrics to a warehouse, then run an allocation job that joins the two and writes out per-customer figures automatically.
Automating this early pays off twice: it removes the manual re-work every month, and it forces the tagging and telemetry discipline that makes the numbers trustworthy in the first place. Our DevOps-led cloud cost playbook covers building this kind of reporting into an existing engineering workflow without it becoming a side project nobody maintains.
A quick personal note from Kori
The averages that surprise teams most are almost always caused by one or two accounts running unusually heavy background jobs. Pull your top five customers by raw compute usage this hour. That single check often explains more than a month of dashboard-watching.
Get a clear picture of your own cloud cost per customer
A platform can be built to find exactly this kind of distortion, the heavy accounts, the pooled database nobody apportioned correctly, the feature flag still burning compute in production. An AI agent analyses billing and telemetry continuously, and specialists can turn what it finds into changes to be implemented.

The simplest way to start is a free Savings Opportunity Report, with savings verified directly on your bill rather than projected. From there, our FinOps as a Service plans, Monitor, Advisor, Embedded and Premium, give you ongoing coverage, and our pricing page explains how our success fee works.
FAQ
Is there a cost for using the cloud?
Yes, every major provider charges for compute, storage, networking and related services, typically billed monthly based on actual usage. The size of that bill depends heavily on architecture choices, not just the volume of customers served.
Can I host my own cloud server?
Yes, self-hosting or running on-premises hardware is possible instead of using a public cloud provider, though it shifts costs from a monthly bill to upfront hardware and ongoing maintenance. Teams running hybrid setups still need to fold that hardware cost into their per-customer calculation alongside any cloud spend.
What pricing model does AWS use?
AWS prices primarily on a pay-as-you-go basis across compute, storage and data transfer, with additional options such as reserved instances and savings plans for lower rates against a usage commitment. Which model applies to a given workload materially changes how shared costs should be apportioned per customer.
How much does 100 GB of cloud storage cost?
Storage pricing varies by provider, storage class and region, so there is no single figure that applies everywhere. The right approach is checking the specific provider's current published storage rates for the storage class in use, since cold and archival tiers price very differently from standard tiers.
Sources
- Cloud cost per user
- Calculating SaaS cost per tenant: a POC implementation in an AWS Kubernetes environment