FinOps Inform
Reduce logging costs on cloud platforms: a DevOps guide
Learn effective strategies to reduce logging costs on cloud platforms. Cut unnecessary expenses and optimize your cloud resources today.

The fastest way to cut cloud logging bills is to stop paying for logs you never query. Measure ingestion volume first, apply exclusion filters at the router before bytes are billed, sample high-volume low-value streams, route archival data to object storage, and set retention windows with budget alerts to catch spikes early.
Ingestion is almost always the dominant cost driver. On GCP, for example, Cloud Logging charges $0.50 per GB beyond a 50 GB free tier per project per month. Most teams are surprised by how quickly health checks and verbose framework output consume that allowance.
Quick wins you can apply in under 30 minutes:
- Check your billing console for ingestion bytes by project and identify the top three sources.
- Set production log levels to WARN or ERROR for application frameworks (Spring Boot, Django, Rails).
- Add a Log Router exclusion for health-check endpoints and kube-system namespace noise.
- Create a sink to object storage for audit logs, paired with a router exclusion to avoid double-ingestion.
- Enable percentage-based sampling for load balancer 2xx responses.
- Set a budget alert on log bytes ingested at 20% above your current monthly baseline.
Key takeaways
Ingestion volume is the primary cost driver for cloud logging, and exclusion filters applied at the router level before bytes are billed are the highest-leverage fix available to any team.
| Point | Details |
|---|---|
| Measure before you cut | Query ingestion bytes by service for 30 days to identify the top sources driving 80% of volume. |
| Exclude at the router | Apply exclusion filters for health checks and debug output before ingestion; this eliminates both ingestion and storage charges. |
| Sample chatty streams | Apply 5–10% sampling to LB 2xx and VPC flow logs; keep error and security streams at 100%. |
| Route archives to object storage | Pair every export sink with a router exclusion on the default sink to avoid double-ingestion charges. |
| Set alerts and budgets | Alert on log bytes ingested at 120% of baseline and set billing budget alerts at 80% and 100% of your monthly target. |
| Koritsu AI | Koritsu AI identifies ingestion waste and misconfigured sinks across AWS, GCP, and Azure, charging only on verified savings. |
How do you measure where your logging costs originate?
You cannot cut what you have not measured. The measurement approach is straightforward: identify daily GiB ingested per service, subtract the free tier, multiply by the per-GiB price, and project monthly cost. Most teams find that the top three to five sources explain 80% of total volume.
Billing lines to inspect across the three major clouds:
- Ingestion bytes: the primary charge on GCP Cloud Logging and AWS CloudWatch Logs.
- Stored bytes: ongoing retention charges, especially for long-lived log groups.
- Query and analytics costs: CloudWatch Logs Insights charges per GB scanned; BigQuery charges per query byte.
- Export and egress costs: cross-region or internet egress fees when routing logs outside the originating region.
| Metric to query | Where to find it | What to look for |
|---|---|---|
| Log bytes ingested per project | GCP: Billing > SKU filter "Log Volume" | Projects above free tier threshold |
| Top log sources by volume | GCP: Logs Explorer > group by logName | Services emitting >5 GB/day |
| CloudWatch log group size | AWS: CloudWatch > Log Groups > Stored bytes | Groups with retention set to "Never expire" |
| Log Analytics ingestion | Azure: Monitor > Usage and estimated costs | Workspaces with unexpected ingestion spikes |
Build a cloud cost dashboard that tracks these metrics weekly. Without a reproducible baseline, you cannot attribute savings after each change.
How to stop wasteful logs before they are billed
Practitioner audits consistently show that 40–60% of log volume comes from three categories: health-check endpoints, verbose framework debug output, and duplicate logs written to multiple sinks. Fixing these three areas typically delivers the largest single reduction in ingestion cost.
Exclusion filters applied at the router level prevent bytes from being ingested at all, which means no ingestion charge and no storage charge. This is fundamentally different from deleting logs after ingestion, where you have already paid.
Steps to apply exclusions safely:
- Open Logs Explorer and build a filter expression matching the logs you want to exclude (e.g.
resource.type="k8s_container" AND resource.labels.namespace_name="kube-system"). - Verify the filter returns only the expected log entries and note the approximate daily volume.
- Add the filter as a Log Router exclusion with a 100% discard rate.
- Monitor ingestion metrics for 24 hours to confirm the volume reduction matches your estimate.
- Repeat for the next highest-volume culprit.
Common high-volume culprits worth targeting first:
- HTTP health-check and readiness probe logs (often 10–30% of total volume on Kubernetes workloads).
- DEBUG and TRACE level output from application frameworks left on in production.
- Duplicate sinks routing the same log stream to both Cloud Logging and an external destination without an exclusion on the default sink.
- VPC flow logs at the default sampling rate (reduce to 0.1 or lower for non-security workloads).
Pro Tip: Before deploying any exclusion to production, use Logs Explorer's preview mode to validate the filter expression returns exactly the entries you intend to drop. A filter that is too broad can silently discard security-relevant logs.
The Google Cloud blog's four-step framework (analyse, eliminate waste, optimise lifecycle, set alerts) maps directly to this sequence. Treat elimination as the second step, not the first.
When should you sample chatty log streams?
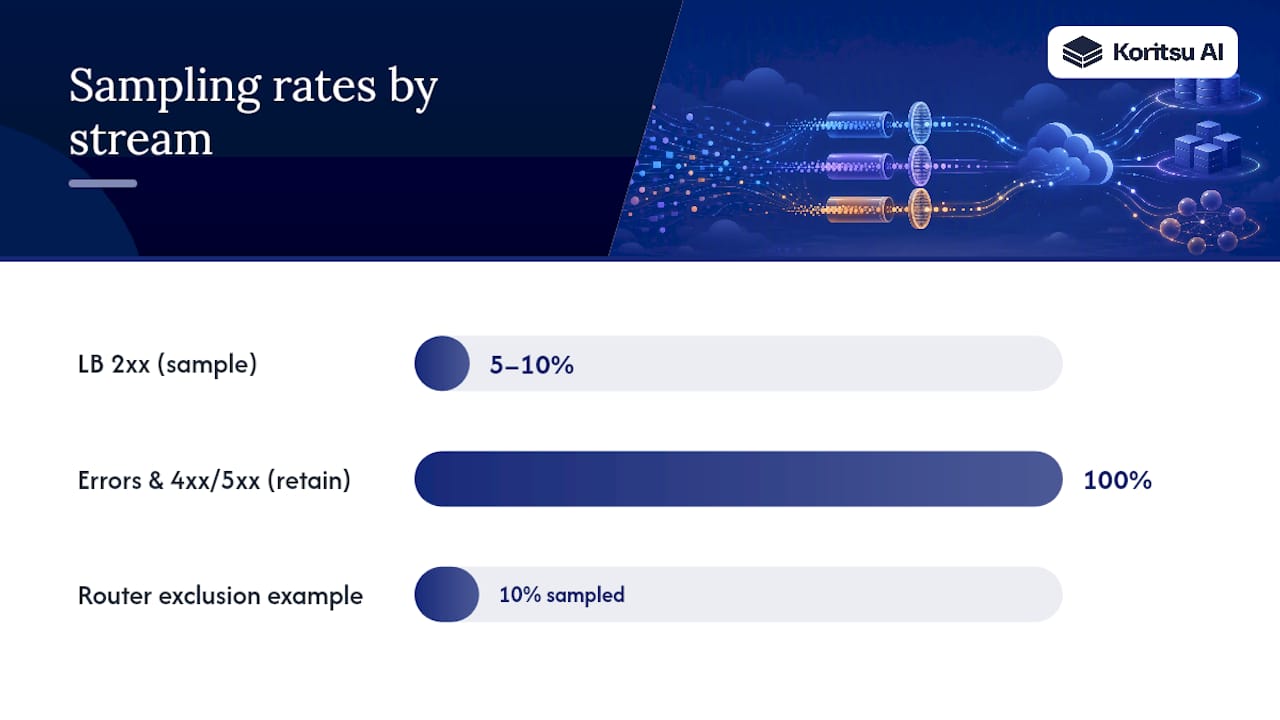
Sampling is the right tool when a stream is high-volume but individually low-value, and where losing some entries does not affect your ability to diagnose incidents. Exclusion is appropriate when you never need the logs; sampling is appropriate when you need a representative subset.
Streams that are good candidates for sampling:
- Load balancer 2xx access logs (sample at 5–10%; errors and 4xx/5xx should remain at 100%).
- VPC flow logs for non-regulated traffic.
- Bulk telemetry from IoT or event-streaming pipelines where aggregate patterns matter more than individual records.
Before sampling any stream, confirm it is not subject to a compliance or forensic retention requirement. PCI-DSS, ISO 27001, and UK FCA regulations may require complete audit trails for specific event types. Sampling those streams creates a compliance gap that is expensive to remediate.
Sampling techniques to consider:
- Percentage exclusions: discard a fixed proportion at the router (e.g. 90% of LB 2xx logs). Simple to configure, but introduces statistical bias if the discarded fraction is not random.
- Deterministic trace sampling: for distributed tracing, use a head-based or tail-based sampler (OpenTelemetry supports both) so complete traces are preserved rather than partial ones.
- Reservoir sampling: keeps a fixed count per time window regardless of traffic spikes, useful for preserving rare events in a high-volume stream.
For Prometheus-based metrics, adjusting scrape intervals from 15 seconds to 60 seconds can reduce metric ingestion substantially with minimal loss of fidelity for most workloads. Apply the same logic: sample aggressively where resolution does not matter, preserve resolution where it does.
Should you route logs to cheaper storage destinations?
For logs you need to retain but rarely query, routing to object storage is typically an order of magnitude cheaper than keeping them in native log storage. Practitioner examples on GCP show large savings when archival logs are routed to GCS Nearline or Coldline via a sink, compared with Cloud Logging's per-GB storage rate.
The critical rule: pair every export sink with a router exclusion on the default sink. Without the exclusion, logs flow to both destinations and you pay ingestion costs twice.
| Destination | Best for | Cost profile | Query experience |
|---|---|---|---|
| Native log storage (Cloud Logging / CloudWatch) | Active debugging, last 7–30 days | Higher per-GB storage | Fast, native tooling |
| Object storage (GCS / S3 / Azure Blob) | Archival, compliance retention | Very low per-GB storage | Requires Athena, BigQuery, or manual retrieval |
| BigQuery / Athena | Ad-hoc analytics, long-term trend queries | Low storage, pay-per-query | SQL-based, scalable |
| External SIEM or log platform | Security events, cross-cloud correlation | Vendor-dependent | Vendor tooling |
Storage-tier guidance for UK-region deployments: use europe-west2 (London) buckets for data residency compliance. Cross-region egress to us-central1 or other regions adds egress costs that can partially offset storage savings, so keep archival buckets in the same region as the originating workload.
What retention windows actually cost you
Retention policy is one of the most overlooked levers for managing logging expenses. Every extra day of hot storage is a recurring charge, and most teams inherit default retention settings that were never reviewed.
Recommended retention tiers:
- Hot (0–7 days): active log storage in the native logging service. Use for real-time debugging and incident response. Keep this window short.
- Warm (7–30 days): extended retention in native storage or a lower-cost log analytics tier. Useful for post-incident reviews and trend analysis.
- Cold (30+ days): archived to object storage (GCS Nearline, S3 Glacier Instant Retrieval, Azure Cool Blob). Suitable for compliance and forensic retention.
Qualitatively, moving from a 90-day default retention in Cloud Logging to a 14-day hot window with archival to GCS Nearline typically reduces storage costs significantly, because you are paying native storage rates only for the active window and object storage rates for the remainder.
How do you set guardrails to avoid surprise billing spikes?
Alerts on log ingestion volume are the safety net that makes every other optimisation sustainable. Without them, a single misconfigured deployment or a new verbose service can erase months of savings in days.
Metrics to alert on:
logging.googleapis.com/billing/bytes_ingested(GCP): alert when daily ingestion exceeds 120% of the 7-day rolling average.IncomingBytesper log group (AWS CloudWatch): alert on groups that double in size within 24 hours.DataIngestionin Log Analytics (Azure): alert when workspace ingestion exceeds a defined daily cap.
Escalation runbook:
- Pilot alert: ingestion exceeds 110% of baseline. Notify the on-call engineer; no automated action.
- Warning: ingestion exceeds 130% of baseline. Trigger a Slack/Teams notification to the platform team and open an investigation ticket.
- Throttle: ingestion exceeds 200% of baseline. Automatically apply a temporary exclusion filter on the top-volume source identified by the metric.
- Rollback: if the throttle exclusion causes a monitoring gap, revert and escalate to a senior engineer.
Pair ingestion alerts with billing budget alerts set at 80% and 100% of your monthly logging budget. Anomaly detection in GCP's billing console and AWS Cost Anomaly Detection can catch unusual patterns before they reach the alert threshold.
Platform-specific controls: GCP, AWS, and Azure
Each cloud provider exposes the same conceptual levers (exclusion, routing, retention, alerting) through different interfaces. The table below maps the control to its platform equivalent and typical command.
| Control | GCP | AWS | Azure |
|---|---|---|---|
| Exclusion filter | Log Router > Exclusions | Subscription filter (CloudWatch) | Diagnostic Settings filter |
| Route to object storage | Sink to GCS bucket | Export to S3 via subscription filter | Diagnostic Settings > Storage Account |
| Retention policy | Log bucket retention | Log group retention policy | Log Analytics workspace retention |
| Ingestion alert | Cloud Monitoring metric alert | CloudWatch metric alarm on IncomingBytes | Azure Monitor alert on ingestion metric |
GCP example: create a sink with an exclusion using gcloud:
gcloud logging sinks create archive-sink \
  storage.googleapis.com/my-archive-bucket \
  --log-filter='severity<WARNING'

gcloud logging exclusions create exclude-health-checks \
  --description="Drop health check logs" \
  --log-filter='httpRequest.requestUrl=~"/health"' \
  --discard-percentage=100
AWS: use a CloudWatch subscription filter to route logs to S3 via Kinesis Data Firehose, then set a retention policy on the source log group:
aws logs put-retention-policy \
  --log-group-name /app/production \
  --retention-in-days 14
Azure: configure Diagnostic Settings via the CLI to route to a Storage Account in uksouth:
az monitor diagnostic-settings create \
  --name archive-to-blob \
  --resource <resource-id> \
  --storage-account <storage-account-id> \
  --logs '[{"category":"AuditLogs","enabled":true}]'
For multi-cloud governance, a multi-cloud management platform can centralise policy enforcement across these three control planes, reducing the risk of one cloud's settings drifting out of alignment.
What are the hidden costs teams consistently miss?
Self-hosting an observability stack can lower direct infrastructure costs, but the engineering time required for patching, backup, restore testing, and capacity management often exceeds the savings for teams below a certain scale. A hybrid model, managed cloud logging for mission-critical and recent logs, object storage for archives, tends to be more cost-efficient once you account for operational overhead.
Hidden costs that frequently appear in post-optimisation reviews:
- Double-ingestion: a sink routes logs to an external destination while the default sink continues to ingest the same stream. The fix is a router exclusion on the default sink.
- Query processing fees: CloudWatch Logs Insights charges per GB scanned. Running broad queries against large log groups without time-range filters can generate significant query costs independent of storage.
- Egress costs: exporting logs from
eu-west-2to an external SIEM or to a bucket in another region incurs egress charges. Keep archival buckets in the same region as the source. - Engineering time: each self-hosted component (Elasticsearch, Loki, Grafana) requires patching cycles, capacity reviews, and on-call coverage. For many mid-sized teams, this overhead costs more than the managed service.
Pro Tip: Run a quarterly "sink audit" to list all active sinks and their destinations. Orphaned sinks routing to deleted buckets or decommissioned endpoints still incur ingestion charges on some platforms.
The decision framework: use native cloud logging for the hot window, object storage for cold archival, and consider a managed FinOps approach to cloud infrastructure costs when the engineering overhead of self-hosting starts to exceed the cost of the managed service.
A concrete rollout checklist for logging cost reduction
Run this sequence in staging before touching production. Each step has a measurable outcome.
- Baseline measurement: query ingestion bytes by service for the past 30 days. Record the top five sources and their daily GiB. Calculate estimated monthly cost using the formula:
(daily GiB - free tier GiB) × price per GiB × 30. - Low-risk exclusions: add exclusion filters for health checks and kube-system namespace. Deploy to staging, verify volume reduction in Logs Explorer, then promote to production.
- Log level tuning: set production application log levels to WARN or ERROR. Confirm in staging that error detection is unaffected.
- Sampling pilot: apply a 10% sample rate to LB 2xx logs in one region. Monitor for 7 days; confirm no incident-detection gaps.
- Sink and exclusion for archival: create a sink to object storage for logs older than 7 days. Add a router exclusion on the default sink for the same filter. Verify no double-ingestion in billing.
- Retention policy update: reduce hot retention to 14 days for application logs. Set lifecycle rules on the archive bucket to transition to Coldline after 90 days.
- Alerting: configure ingestion alerts at 120% and 200% of the new baseline. Set billing budget alerts at 80% and 100% of the revised monthly target.
- Measure and report: after 30 days, compare ingestion bytes and billing lines against the baseline. Attribute savings per change using the billing SKU breakdown.
Validate each filter before deploying by running it in Logs Explorer and confirming the matched volume matches your estimate. A 20–30% discrepancy suggests the filter is either too broad or too narrow.
The part most teams get wrong about logging costs
Most teams treat logging cost as a one-time cleanup task. They run a sprint, cut 40% of ingestion, and move on. Six months later, a new service launches with DEBUG logging on by default, a new sink gets created without a paired exclusion, and the bill climbs back to where it started.
The real problem is not the logs themselves. It is the absence of governance. Nobody owns the logging cost line. Platform teams assume application teams are managing verbosity; application teams assume the platform has guardrails. Neither is wrong, but the gap between those assumptions is where the money goes.
The fastest wins are always health-check exclusions and framework log-level tuning. They require no architectural change and typically yield a 30–50% reduction in ingestion within a week. But the durable wins come from making logging cost a first-class metric in your engineering culture: tracked weekly, owned by a named team, and gated by an alert that fires before the bill arrives.
Koritsu AI can accelerate your logging cost reduction
Logging cost is one of the clearest examples of a problem that looks technical but is actually a process problem. The controls exist on every platform. The challenge is finding where the waste is, prioritising the fixes, and making sure the savings stick.

Koritsu AI combines continuous AI-driven analysis with hands-on FinOps expertise to do exactly that. Kori, our AI agent, surfaces ingestion anomalies, orphaned sinks, and misconfigured retention policies across your AWS, GCP, or Azure estate. Our specialists help your team act on the findings, from filter expressions to Terraform modules, without adding to your engineering backlog. We charge on verified savings, so the engagement pays for itself. UK teams can start with a free assessment or see a verified UK case study before committing. When you are ready to pilot, get in touch and we will scope the work within a week.
Sources
The following references cover platform-specific controls, implementation guidance, and deeper practitioner context for the techniques in this guide. For platform commands and Terraform modules, the official GCP and AWS documentation linked below are the authoritative starting points.
- Cloud Logging cost management best practices
- This page describes how you can optimize and monitor your Google Cloud Observability costs. For pricing information, see Google Cloud
- Cloud Log Management at Scale: Costs, Retention, and Avoiding the $10K/Month Surprise | CloudToolStack
- 6 techniques to reduce cloud observability cost | InfoWorld
- How to Calculate and Optimize Cloud Logging Costs by Analyzing Ingestion Volume