FinOps Inform
Why API calls generate cloud cost, and how to control it
Discover why API calls lead to cloud costs and learn effective strategies to manage expenses with insights on provider billing and optimization.

Every API call generates cloud cost because it triggers a metered chain of provider events: request handling, compute time, memory, network egress, and often storage or logging, each billed independently. The bill you see is the sum of every one of those triggered charges, not just the “per call” line.
Three things drive most of that spend:
- Provider pricing models — pay-per-call, tiered volume pricing, or subscription-plus-usage all charge differently for the same traffic pattern.
- Downstream resource use — compute time, egress, storage I/O, and third-party calls a single request sets off.
- Hidden multipliers — retries, non-production environments, and oversized payloads that inflate the real cost without showing up as a distinct line.
What follows covers how providers actually bill, how to calculate your own cost per call with worked examples, and which optimisations pay off fastest.
Key Takeaways
API calls generate cloud cost because each request triggers a chain of billable events across compute, storage, network, and monitoring, not just a single gateway fee.
| Point | Details |
|---|---|
| Pricing models differ | Pay-per-call, tiered volume, and subscription-plus-usage models all bill the same traffic differently. |
| One call, many charges | Compute time, egress, storage I/O, and logging can all bill separately from the gateway fee. |
| Retries multiply cost | A naive retry loop can push per-call cost several times higher once downstream fan-out is included. |
| Attribution needs mapping | Quota project and billing project can differ, so tag resources by team before traffic scales. |
| Non-production spend hides | Development and QA environments can represent a large share of tech spend if left untracked. |
| Continuous beats periodic | Ongoing observation and remediation, the approach Koritsu AI’s platform and FinOps team apply, closes the insight-to-action gap that quarterly reviews miss. |
How cloud providers charge for API requests
Cloud and API providers rarely use one pricing model. Most combine two or three, and understanding which applies to which service on your bill is the first step to controlling spend.
- Pay-per-call: a fixed or tiered rate multiplied by the number of requests. This is the simplest model and the easiest to forecast, but it scales linearly with traffic, so a viral spike hits your invoice immediately, as Stripe’s breakdown of API call pricing explains.
- Tiered volume pricing: rate drops as volume rises, rewarding scale but punishing unpredictable, bursty traffic.
- Subscription-plus-usage: a base fee covers an allowance of calls, with overage charged per unit once you exceed it. Many managed AI and analytics APIs use this structure.
- Credit or token buckets: common with managed inference APIs, where usage draws down a pool priced by input/output tokens rather than raw call count.
Google Cloud API Gateway is a clean example of pure per-call gateway billing: each request that passes through the gateway carries an invocation charge, visible as its own pricing line separate from whatever backend service actually does the work. AWS API Gateway and Azure API Management follow the same logic, charging per million requests plus separate fees for data transfer and any premium features like caching or private endpoints.
Region and service tier also move the number. Some managed APIs, including certain OpenAI API endpoints, apply regional processing uplifts and cache read/write multipliers that change the effective rate per call depending on where and how you invoke them, according to OpenAI’s own pricing documentation. A “cheap” call in one region can cost noticeably more in another.
What does a single API call actually cost you?
Treat one request as a chain reaction, not a single line item. The gateway charge is usually the smallest part of the bill.
Direct, per-request charges include:
- API gateway or managed-service invocation fees
- Token or input/output billing for AI model calls
- Priority-tier or fast-mode surcharges where offered
Downstream costs the call triggers include:
- Compute execution time and memory allocation
- Ephemeral storage and storage I/O
- Database reads and writes
- Network egress, especially cross-region
- CDN costs if content is served or cached
- Logging, tracing, and monitoring ingestion
- Any downstream third-party API calls the handler fans out to
Indirect charges that rarely get modelled include non-production copies of the same service running in staging and QA, CI/CD pipelines hitting live or sandboxed APIs on every build, and payload size inflating both compute time and egress simultaneously.
Retries are where costs quietly multiply. A client with a naive retry loop, three attempts, no backoff, no circuit breaker, doesn’t add 3x cost. It adds 3x cost to every downstream service the call touches, including database queries and third-party APIs, so a single failure can compound to 5x or more once fan-out is involved.
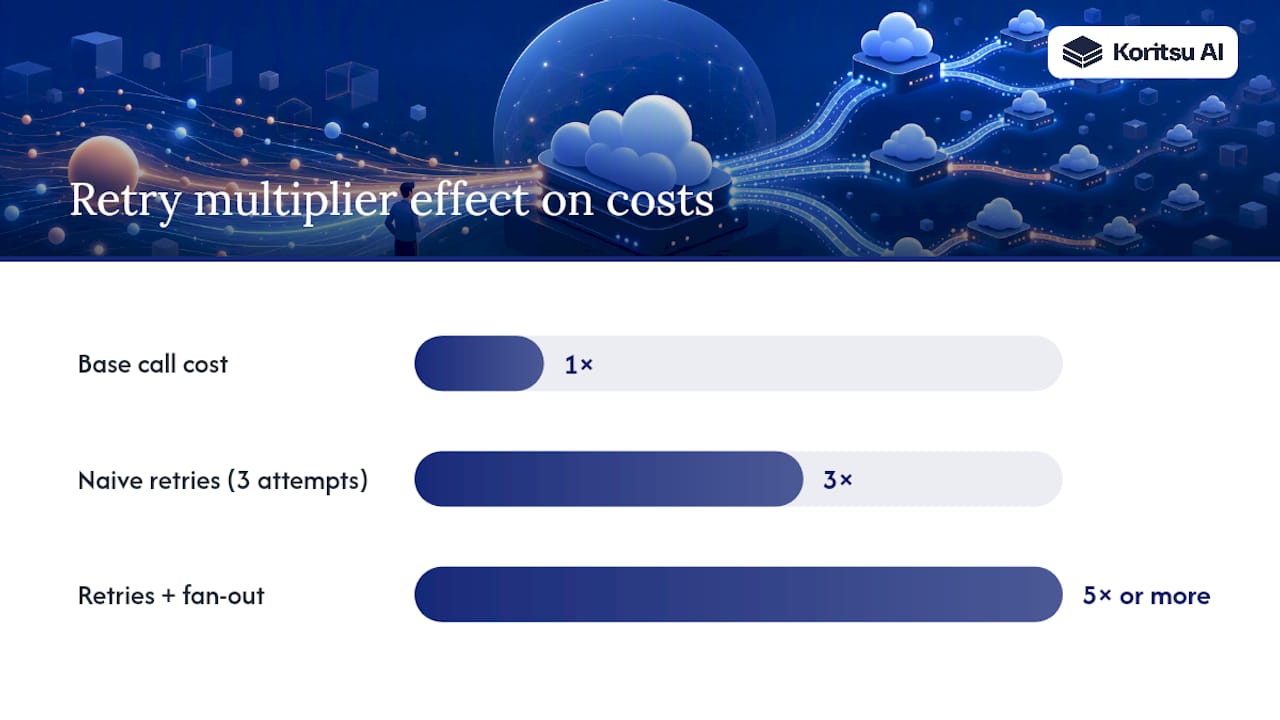
Pro Tip: Instrument retry counts as a first-class metric alongside request count. If your dashboards only show total invocations, you’re blind to the multiplier effect until the invoice lands.
Non-production environments often carry more weight than teams expect. Commentary from The New Stack cites development and QA work accounting for roughly 30% of tech spend in some organisations, a share that’s easy to lose track of when nobody owns the staging bill.
How does billing attribution actually work?
Cost attribution is where most FinOps confusion starts, because the project that issues a request isn’t always the one that pays for it.
Google Cloud draws a distinction between the quota project (which enforces rate limits and quota on a request) and the billing project (which absorbs the actual charge). These can differ, particularly in shared-service architectures where a central API gateway issues requests on behalf of multiple teams. Google’s service control reference documentation details how individual requests are logged and mapped to billable events, which is the trail you need if you’re trying to reconcile an invoice line back to a specific team’s traffic.
On a typical bill, API-related costs surface across several separate resources:
- The gateway or API management resource itself
- The compute instance or serverless function executing the logic
- Storage buckets holding request/response payloads or logs
- Egress line items, often the least visible and most variable
A quick attribution checklist for GCP-style environments:
- Confirm which project each service account’s quota is drawn from.
- Check whether billing is centralised or delegated per project.
- Tag resources by team or feature before traffic scales, not after.
- Track free-tier usage separately, since exceeding it silently shifts marginal cost from zero to the standard rate.
How do you calculate the cost of an API call?
A workable formula sums the direct per-call charge with amortised downstream resource use:
Cost per call = gateway fee + (compute time × compute rate) + (egress GB × egress rate) + (storage I/O × storage rate) + (logging/monitoring cost per call)
Two worked examples show how differently this plays out depending on architecture.
- Serverless endpoint. A function runs for 150ms at 256MB memory, returns a 10KB response, and logs standard request metadata. Compute cost is fractions of a cent per invocation, egress is negligible at that payload size, and the gateway invocation fee (per Google Cloud API Gateway’s pricing) is the dominant line. At low volume this is cheap; at millions of calls a day, the gateway fee alone becomes the biggest cost driver, not compute.
- Managed inference API call. A request sends 500 input tokens and receives 300 output tokens from a hosted model. Token-based pricing (check the provider’s current pricing page for exact rates, since these shift frequently) typically dwarfs the compute and storage cost of the wrapper service calling it. Add a priority-mode multiplier or regional uplift, and the per-call cost can jump 10% or more purely from routing choices, as OpenAI’s pricing documentation notes for certain regional processing.
Sensitivity matters more than the base estimate. Doubling payload size raises both compute time and egress simultaneously. Tightening an SLO to reduce latency often means provisioning more memory or reserved capacity, raising the compute rate even if call count stays flat. Retry rate is the most volatile variable: run the formula at 0%, 5%, and 20% retry rates to see how fast a “cheap” call becomes an expensive one under real-world failure conditions.
What hidden costs make API bills higher than expected?
The gap between forecast and actual invoice usually comes from costs nobody assigned to a specific team.
- Parallel non-production environments running the same API surface as production, often at full request volume during load testing.
- CI/CD pipelines making live or near-live API calls on every commit, multiplied across every branch and pull request.
- Excessive logging and trace retention, particularly verbose debug logging left on after an incident is resolved.
- Cross-region egress from microservice fan-out, where one user request triggers calls across multiple regions before returning a response.
- Chargeable cache writes and monitoring ingestion, which scale with traffic just like the API itself.
- Third-party API chaining, where your service calls a partner API that itself has its own metered cost.
Development and QA environments account for roughly 30% of tech spend in some organisations according to The New Stack’s reporting, a figure that rarely appears on anyone’s dashboard because non-production spend is usually pooled into a general infrastructure line rather than tracked per service. Siloed budgets compound this: when finance owns the cloud bill and engineering owns the architecture, system-level savings opportunities fall into the gap between the two teams.
What can you do now to cut API-driven cloud cost?
Fixes split naturally into three horizons, and starting with the cheapest ones buys time to plan the bigger changes properly.
Short-term, days not weeks:
- Cache responses for anything that doesn’t need to be real-time.
- Batch requests where the API supports it, rather than calling once per item.
- Trim payload sizes by removing unused fields from requests and responses.
- Tighten retry logic with exponential backoff and a maximum attempt cap.
- Sample logs and metrics instead of capturing every event at full verbosity.
Medium-term, weeks:
- Replace polling loops with event-driven triggers or webhooks.
- Introduce a server-side caching proxy in front of expensive or frequently repeated calls.
- Adopt cursor-based pagination and delta updates instead of refetching full datasets.
- Review serialization format, since verbose JSON payloads cost more in both compute and egress than compact alternatives.
Longer-term, architectural:
- Decompose overly chatty services so bounded domains don’t fan out unnecessarily.
- Route traffic through cheaper regions where latency requirements allow.
- Move batch-friendly workloads onto genuine batch APIs rather than looped single calls.
- Shift asynchronous work onto queues instead of synchronous request chains.
- Push non-critical logs and archives onto cheaper storage tiers.
Pro Tip: Rank every fix by effort versus impact before you touch code. Caching and payload trimming usually deliver 80% of the short-term saving for 20% of the engineering effort, so do those first. Practical implementation detail for several of these lives in EndPlex’s guide to API performance optimisation and in Koritsu AI’s own playbook on optimising API calls in cloud services.
Why does continuous optimisation matter more than one-off reviews?
A one-off cost review tells you what happened last quarter. It doesn’t tell you what’s happening right now, which is why the gap between spotting waste and actually removing it, often called the insight-to-action gap, is where most savings quietly disappear, as The New Stack argues.
Closing that gap means running a loop rather than a report:
- Observe: distributed tracing linked to billing IDs, so every trace can be matched to the exact charge it caused.
- Analyse: unit economics per feature or team, not just total spend, so cost per transaction is visible alongside SLO performance.
- Act: automated remediation or a clear runbook for the most common waste patterns (unused caches, orphaned test environments, retry storms).
- Verify: a safety check, ideally an A/B comparison, confirming the fix reduced cost without harming reliability.
The tooling checklist is short: capture trace IDs alongside billing identifiers, build a dashboard that shows cost per endpoint rather than only total spend, set anomaly alerts on sudden call-volume or egress spikes, and automate the obvious fixes, like killing idle non-production environments overnight, rather than relying on someone remembering to do it. More on building this out is in Koritsu AI’s guide to cloud observability for cost.
Your one-week plan to cut API cost
- Day 1: Enable request-level tracing across your top APIs. Metric: trace coverage percentage.
- Day 1-2: Map your top 10 endpoints by invocation volume. Metric: calls per endpoint per day.
- Day 2-3: Measure average payload size and retry rate per endpoint. Metric: KB per request, retries per 1,000 calls.
- Day 3-4: Calculate cost per call using the formula above for your top 3 endpoints. Metric: £ per call.
- Day 4-5: Implement short-term caching and cut logging verbosity on the worst offender. Metric: cache hit rate.
- Day 5-6: Set rate limits and retry caps where none exist. Metric: peak requests per second.
- Day 7: Re-measure cost per call and compare against Day 4’s baseline. Metric: % change in spend.
Why continuous optimisation beats the annual cost review
Most engineering teams treat cloud cost as an audit exercise, something you do once a quarter when finance asks questions. That’s backwards. Cost is generated continuously, call by call, so the only way to control it is to watch it continuously too.
The teams that get real, durable savings are the ones who wire cost telemetry into the same pipeline as performance telemetry, so an engineer debugging latency sees the cost impact in the same view.
Pro Tip: Start by tying trace IDs to billing line items before you build a single dashboard. Everything else Koritsu AI does with clients, anomaly detection, root cause analysis, remediation, builds on that one link existing first.
Get a free assessment of your API-driven cloud spend
If you’ve read this far and you’re already mentally tallying your own gateway invocations, retry rates, and non-production environments, that instinct is exactly right, and it’s also exactly what a proper assessment should quantify rather than guess at.

Koritsu AI runs a free assessment that measures cost-per-call hotspots, non-production waste, and the quick wins covered above, caching gaps, retry multipliers, oversized payloads, before recommending a single architectural change. We only take a share of the savings we actually find, so there’s no cost to finding out where your API spend is leaking. From there, teams can move onto an ongoing subscription for continuous monitoring rather than waiting for the next quarterly review to catch the next leak. Start with the free assessment on Koritsu AI’s site and see what your own top endpoints are really costing you.
Frequently asked questions
Why do API calls generate cloud cost even when the API itself is free to use? A “free” API often still triggers billable compute, storage, or egress on your own infrastructure. The API’s zero fee doesn’t mean the request is free, only that one specific line item isn’t charged.
What’s the biggest hidden cost of API requests? Retries and non-production environments tend to surprise teams most, since neither shows up as an obvious line item, yet both can multiply real spend well beyond the visible per-call rate.
Does GraphQL cost more or less than REST? It depends on the workload. GraphQL can reduce over-fetching and cut the number of round trips, lowering egress and call count, but poorly bounded queries can trigger expensive backend joins that a simple REST endpoint would never allow.
How do I find out which team is generating the most API cost? Start with billing attribution: check whether your quota project and billing project match, tag resources by team, and build a dashboard that shows cost per endpoint rather than only total spend.
Is it worth paying for a managed API gateway instead of building one? Managed gateways like AWS API Gateway or Azure API Management remove the operational overhead of running your own, but their per-call fees still need to be modelled into your cost-per-call formula, especially at high volume.