FinOps Inform
Shift FinOps Left: Engineers Balance Cloud Cost with Verified Savings
Koritsu shows engineers how to shift FinOps left: measure cost per transaction, protect SLOs, run verified pilots, and capture savings proven against your...

We balance cloud cost and performance by optimising for business value, not raw spend: measure cost per unit of work, link it to service-level objectives, and embed cost-aware decisions directly into the engineering lifecycle. The main levers are visibility and allocation, right-sizing and autoscaling, and architecture choices made before deployment rather than after the bill arrives. This is the model the FinOps Framework now formalises, and it is the approach we apply with clients.
TL;DR:
- Track cost per request or transaction against latency, throughput, and error objectives, since unit costs can change as workloads scale.
- Benchmark instance families before switching; a cheaper option that needs 20% more instances may increase total spend instead of reducing it.
- Use spot capacity for batch or stateless jobs only when a fallback exists; serverless may cost more than reserved compute at sustained high volume.
- Run recommendations in read only mode for a full traffic cycle, then test changes against service objectives before automation, using canaries and rollback controls.
- Verify savings with a baseline, a representative pilot, and specific bill lines; a dashboard estimate alone cannot settle finance disputes.
What balancing cost and performance means in practice
Cost and performance only become comparable once you put them in the same unit. Cost per unit of work (cost per request, per build, per inference) tells you whether an optimisation actually paid off, rather than just shrinking one line of the bill while shifting load elsewhere. Cost per transaction does the same job at the business layer, tying infrastructure spend to revenue-generating activity. Marginal cost matters most under scale: the tenth server rarely costs the same, per unit, as the first.
Service-level objectives for latency, throughput and error rate set the floor you are not willing to cross. Plot cost against a performance metric and you get a cost-performance curve, and most workloads show a clear knee: spend below it buys real headroom, spend above it buys almost nothing.
Finance and engineering need to share the same numbers, or every optimisation conversation turns into a negotiation over whose data is right. That shared layer usually includes:
- Allocation accuracy: the share of spend that can be attributed to a specific team, product or feature.
- Forecasting accuracy: how closely predicted spend tracks actual spend month to month.
- Unit economics: cost per customer, per transaction or per workload, tracked as a trend rather than a snapshot.
Without these three, cost-cutting and performance protection pull in opposite directions by default.
Visibility and allocation: data you need before you optimise
Optimisation decisions are only as good as the data behind them, and most organisations start from a weaker position than they think. The State of FinOps 2025 report finds that practices are expanding FinOps beyond public cloud into SaaS, licensing and data centres, with waste reduction remaining the top priority even as scope widens. Before you touch a single instance, get the foundations right:
- Standardise on canonical billing exports and FOCUS-style formats so cost data from every provider lands in one consistent structure rather than three incompatible ones.
- Build a tagging strategy that reflects how the business actually runs, tagging by team, product and feature rather than by convenience, so costs map to decision-makers.
- Treat allocation as an incentive design problem: if a team’s inefficiency shows up on someone else’s budget, nobody fixes it.
- Wire in continuous ingestion and anomaly alerts rather than relying on monthly invoices, since a misconfigured autoscaler can burn weeks of budget before a human ever notices.
Our guidance on canonical billing exports walks through the practical setup for this layer. Get allocation wrong and you create a familiar failure mode: a team optimises its own visible costs while pushing load onto shared services, and the organisation’s total spend barely moves even though every dashboard looks better. Accurate allocation is what turns cost data into something engineering teams can act on without second-guessing it.
Technical tactics that reduce cost without harming SLOs
Once visibility is solid, the technical work follows a fairly consistent order of operations: baseline first, change one variable at a time, and watch the SLO, not just the invoice.
- Right-sizing and instance-family selection: benchmark the workload on its current family before moving it, since a cheaper instance that needs 20% more of them is not actually cheaper.
- Autoscaling and schedule-based scaling: set floor and ceiling limits that reflect real traffic patterns, and test the scale-down path as carefully as the scale-up path.
- Spot or preemptible capacity: strong for batch and stateless workloads with a fallback pool, risky for anything latency-sensitive without one.
- Architecture choices: caching and batching cut repeated work, async processing smooths spikes, and serverless suits bursty, low-baseline workloads but can cost more than reserved compute at sustained high volume.
- Storage and network optimisation: lifecycle policies that move cold data to cheaper tiers, and egress reduction through smarter data placement, often return savings with almost no performance risk.
Pro tip: Run right-sizing recommendations in read-only mode for at least one full traffic cycle before allowing any automated change to apply itself.
The risk with every item on this list is the same: a change that looks safe in isolation can regress an SLO under conditions the test window never captured, such as a traffic spike or a batch job colliding with peak hours. Our container cost monitoring runbook covers one concrete example of catching this kind of regression before it reaches production, and our serverless cost optimisation guide sets out six techniques with the trade-offs made explicit rather than assumed. For teams evaluating where workloads should sit in the first place, a technical look at alternative VM pricing models is worth reading alongside your own cost-performance curve, since predictable per-instance pricing changes the maths on long-running workloads.
FinOps process and culture: embedding cost-performance trade-offs into teams
Tooling and tactics only produce lasting savings when the organisation around them changes too. The Linux Foundation State of FinOps Survey finds that mature teams embed financial context into the engineering lifecycle and prioritise pre-deployment guidance over after-the-fact bill scrutiny. That is the shift-left principle in practice, and it changes where the conversation happens:
- Put cost into design reviews and CI checks, so an architecture decision gets challenged on cost-per-unit-of-work before it ships, not three months into production.
- Create a cross-functional FinOps routine: a weekly review of anomalies and a monthly forecast reconciliation, with clear decision rights over who approves a trade-off.
- Set SLO-linked budgets with thresholds and escalation paths, so an engineer knows exactly when a cost increase needs sign-off rather than guessing.
- Prioritise using value, impact and effort together, not cost savings alone, since a low-effort fix that barely moves the unit economics is rarely worth the review cycle it consumes.
Our 90-day DevOps cost management guide sets out how to build this routine without adding a layer of bureaucracy that engineering teams quietly route around. The organisations that sustain savings treat cost as a design constraint, equivalent to latency or availability, rather than a finance problem that gets solved once a quarter.
Automation and tooling: categories, and how to pick one
Tooling in this space splits into a few distinct categories, and conflating them leads to disappointment. Provider-native tools such as Azure Cost Management and advisors like Azure Advisor report spend well and surface reasonable recommendations, but they stay within one provider’s walls and rarely execute a fix on your behalf. A reserved-instance suggestion, in particular, needs checking against workload variance before you commit, since the advisor has no view of how stable that workload actually is.
Beyond provider tools, the useful distinctions are:
- Read-only automation flags inefficiency without touching anything, the safer starting point for any new integration.
- Actuation tools apply fixes automatically and need genuine safety controls (tests, canaries, rollback windows) to avoid trading a cost saving for an SLO breach.
- Anomaly detection and spend-guard tooling catch runaway costs in near real time, closing the gap between a misconfiguration and someone noticing it.
When selecting a tool, check data fidelity against your canonical billing export, confirm what actions it actually supports versus what it merely recommends, and verify it integrates with your CI/CD pipeline and issue tracker so a finding becomes a ticket, not a forgotten dashboard alert. Multi-cloud coverage matters disproportionately once you run more than one provider, since that is exactly where single-provider tools stop being useful.
Measure, experiment and verify: turning actions into verified outcomes
An optimisation that has not been measured against a baseline is a guess wearing a dashboard. The sequence that holds up under scrutiny:
- Design a low-risk canary or A/B test on a workload where an SLO breach is tolerable, and decide in advance which latency, throughput and error metrics you are capturing.
- Baseline over a sample period long enough to smooth out noise, accounting for weekly or seasonal traffic patterns rather than a single quiet Tuesday.
- Map the observed metric change back to specific bill lines, not an estimate, so the saving survives a finance review.
- Run a pilot and produce a verified-savings report before any full roll-out, since a result that only exists in a spreadsheet is not yet a result.
Industry guidance from IBM is blunt about why this discipline matters: verified savings need a baseline, an experiment and an auditable mapping to the bill, because skipping that step is exactly what causes disputes between engineering and finance later.
Koritsu perspective: practical examples from engineering-led optimisation
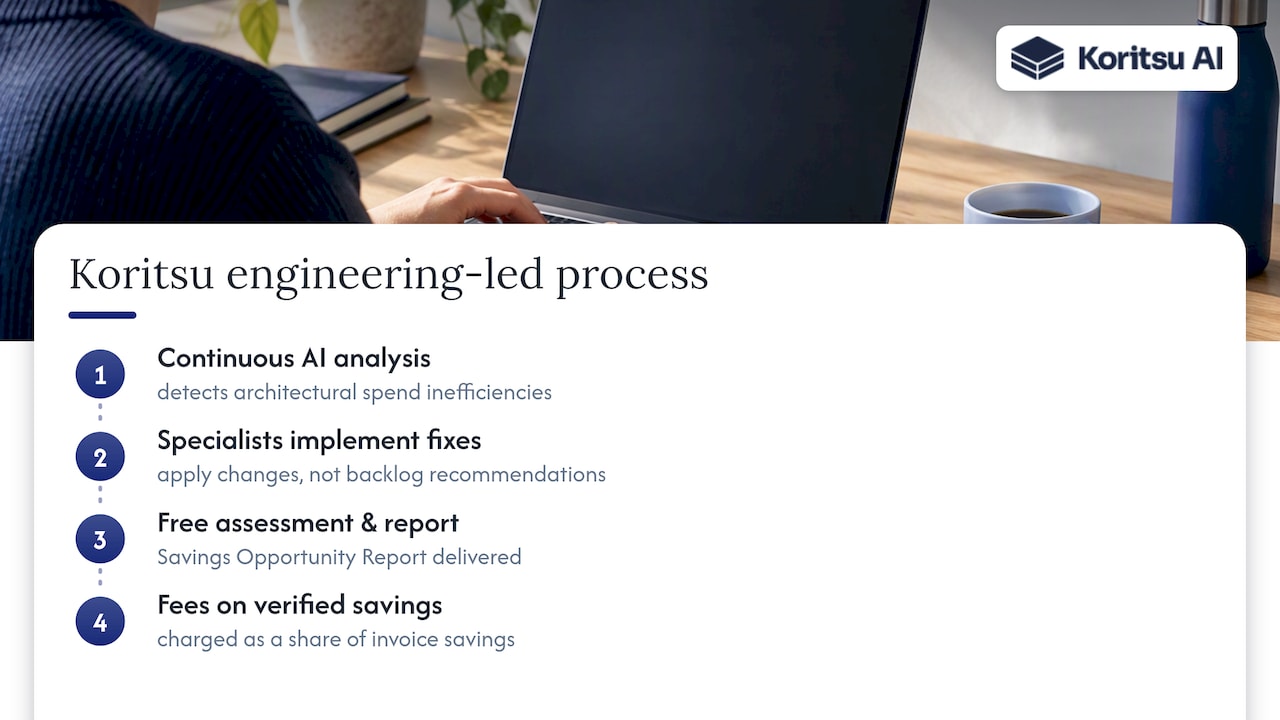
We built Koritsu around the belief that cloud waste is rarely a buying problem. It is usually buried in how systems were architected, not in which discount tier someone picked. An AI agent continuously analyses spend and traces inefficiency back to its architectural root cause, while specialists turn that finding into an implemented fix rather than a recommendation that sits in a backlog.
Commercially, engagements commonly start with a free assessment and a Savings Opportunity Report, and fees are taken as a share of the savings actually verified against the bill. That structure forces the same discipline this article describes: nothing counts until it shows up in the invoice.
Rules of thumb for deciding when to accept a cost increase
Three heuristics help here. Pay for performance when the workload is revenue-critical and the cost increase is smaller than the revenue it protects. Pay when a latency or error-rate threshold affects measurable user behaviour, not just a vanity metric. Otherwise, default to optimisation.
For the board, one page is enough: current unit cost, the SLO at risk, and the specific trade-off being requested. Fund performance-first work when growth depends on it; prioritise optimisation everywhere else.
How Koritsu can help: next steps and links
We built our offering around the same principle this article argues for: optimisation should be judged by verified results, not by how convincing the dashboard looks.

If you want a concrete starting point, the path looks like this:
- Start with a free assessment and Savings Opportunity Report that identifies where spend is being wasted and why.
- Run a verified pilot against your actual billing data, not an estimate, before committing to any wider change.
- Move to an ongoing FinOps as a Service engagement, choosing between Monitor, Advisor, Embedded or Premium depending on how much hands-on support you want.
- Pay through our success-fee pricing model, where we only take a share of savings we have already proven against the bill.
You can see the full platform at Koritsu AI when you are ready to look under the hood.
FAQ
What is the best way to balance cloud cost and performance?
Measure cost against a business-relevant unit, such as cost per transaction, and set that against your existing service-level objectives rather than cutting spend in isolation. The FinOps Framework (2025) formalises this as the Understand, Quantify and Optimize sequence, which keeps cost decisions tied to measurable value rather than guesswork.
How do reserved instances compare with on-demand pricing for cost-performance balance?
Reserved instances suit stable, predictable workloads where you are confident of sustained usage, while on-demand and spot capacity suit variable or experimental workloads where commitment carries more risk than reward. Provider advisors such as Azure Advisor often recommend reservations, but that recommendation should be checked against your own workload variance before committing.
How much cloud spend is typically wasted?
Estimates vary by organisation and methodology, but industry guidance from IBM notes that a material share of cloud spend is commonly wasted, and that visibility and allocation are prerequisites for fixing it safely. The exact figure depends heavily on how mature a given organisation’s FinOps practice already is.
What does shift-left mean in FinOps?
Shift-left means embedding cost considerations into design reviews, architecture decisions and CI checks before code reaches production, rather than reviewing the bill after the fact. The Linux Foundation State of FinOps Survey identifies this pre-deployment guidance as a priority for mature FinOps teams.
How does Koritsu charge for cloud cost optimisation?
We charge a success fee based on a share of the savings we verify against your actual billing data, starting with a free assessment and Savings Opportunity Report. From there, clients can move onto an ongoing FinOps as a Service subscription, with exact pricing available on request through our pricing page.
Sources
- State of FinOps 2025 report
- FinOps Framework (2025)
- State of FinOps Survey (Linux Foundation press release)
- What is cloud cost optimization? | IBM