FinOps Inform
What cloud spending patterns actually look like in 2026
Discover how cloud spending patterns are evolving in 2026. Learn to balance costs and minimize waste for greater efficiency.

Cloud spending patterns are the recurring shape your bill takes across compute, storage, network, and managed services, and for most companies that shape is badly out of balance. Compute and storage still dominate the total, but the fastest-growing lines are AI and GPU workloads, network egress, and observability. If you fix only three things this quarter, fix visibility into where the money goes, rightsize what’s already running, and commit to spend that’s proven stable. Estimated wasted cloud spend rose to 29% in the latest Flexera State of the Cloud Report, and fewer than half of organisations use even a single commitment discount with a given provider.
Pro Tip: Before you optimise anything, spend a week just categorising. You cannot fix a pattern you haven’t named.
Key Takeaways
Cloud spending patterns shift fastest around AI workloads, network egress, and observability, and fixing them requires continuous visibility, sequenced rightsizing, and commitments made only once usage is stable.
| Point | Details |
|---|---|
| Normalise before analysing | Convert multi-cloud billing exports into one schema, such as FOCUS, before comparing spend. |
| Watch the three fast movers | AI inference, egress, and observability commonly explain most unexpected mid-year cost variance. |
| Sequence your levers | Rightsize and stabilise first, then buy commitments; buying early locks in waste. |
| Measure unit economics | Track cost per inference or per user, not just totals, to see if growth is actually efficient. |
| Consider managed continuous analysis | Koritsu AI pairs continuous monitoring with hands-on engineering fixes, charging only on verified savings. |
Understanding cloud spending patterns: data, tagging, and normalisation
You can’t read a pattern in a bill you don’t trust, and most engineering teams don’t trust theirs. The starting point is always the raw billing export: AWS Cost and Usage Reports (CUR), Google Cloud’s BigQuery billing export, and Azure Cost Management data. These give you line-item detail down to the resource, but each provider structures that detail differently, which is exactly why multi-cloud shops struggle to compare spend at all.
Normalisation solves that. The FinOps Foundation’s FOCUS specification has become the closest thing to a vendor-neutral schema for this, mapping AWS, Azure, and GCP billing fields into a common structure so a dollar of compute means the same thing regardless of provider. Skip this step and you’ll spend more time reconciling spreadsheets than acting on what they show you.
Tagging is the other half of the trust problem. Untagged resources are the single biggest reason cost allocation breaks down, because nobody can tell you who owns the spend or why it exists.
- Enforce mandatory tags at resource creation, not after the fact, using policy-as-code rather than a wiki page nobody reads.
- Tag by team, environment, and product feature at minimum, so cost maps to an owner who can actually act on it.
- Reconcile currency and unit conventions across clouds before comparing anything, since a per-hour AWS rate and a per-second GCP rate don’t line up without conversion.
- Treat untagged spend as its own category to chase down, not as noise to ignore.
Get this right and every downstream metric becomes trustworthy. Get it wrong and you’ll optimise the wrong workload with total confidence.
Which KPIs reveal your real spending patterns
Raw dollar totals tell you almost nothing about whether your cloud spend is healthy. The metrics that matter connect cost to output, and they fall into three groups.
- Category and ownership breakdown. Split spend by compute, storage, network, and managed services, then again by team and product. This is where you spot that one feature team is quietly running 40% of your compute bill.
- Unit economics. Cost per inference, cost per transaction, and cost per active user tell you whether growth is efficient or whether you’re scaling cost faster than revenue. A rising total spend with falling cost per user is healthy. The reverse is a warning sign, even if the headline number looks fine.
- Velocity and maturity indicators. Track month-over-month spend velocity by category, your anomaly rate (how often spend deviates from forecast), and how many teams actually review their own cost dashboards. Google Cloud’s own pricing guidance notes that realised cost is consumption multiplied by the effective price you actually negotiated, not list price, which is why unit economics can shift even when usage stays flat.
Most teams can name their total spend instantly and their cost per feature never. That gap is usually the clearest sign a FinOps practice hasn’t matured past the invoice-reading stage.
What’s driving the shift in cloud expenditure trends
The shape of a typical bill has changed more in the last two years than in the previous five, and three forces explain most of it. A mid-year cost spike is usually explained by one of these three categories, according to analysis from Future of Software, which found AI inference, egress, and observability responsible for 22 to 31% of unexplained cost variance.
-
AI and GPU workloads introduce huge variance because inference cost scales with usage in ways autoscaling wasn’t originally designed for, and the supporting infrastructure (vector databases, embedding pipelines, model storage) hides costs that never show up on the GPU line itself.
-
Network egress and cross-region transfer are the quiet killers. DigitalOcean’s breakdown of cloud billing points out that per-GiB charges look trivial in isolation but compound fast across chatty microservices or multi-cloud replication, often reaching 10 to 15% of total spend.
-
Observability and telemetry grow with cardinality, not intent. Nobody sets out to spend a fortune on logs, but every new metric, trace, and debug log adds ingestion cost that scales with system complexity rather than business value.
-
SaaS sprawl and managed services add a steady baseline that rarely gets reviewed, because nobody owns the renewal decision the way they own a compute budget.
None of these show up cleanly on a single line item, which is exactly why they get missed in a standard monthly review.
The operational levers that actually change your bill
Fixing spending patterns isn’t about heroics. It’s a sequence, and the order matters as much as the tactics themselves.
Start with visibility, because you cannot rightsize what you can’t see. Dashboards tied to your tagging structure, paired with anomaly detection that flags spend deviating from a rolling baseline, catch problems while they’re still small.
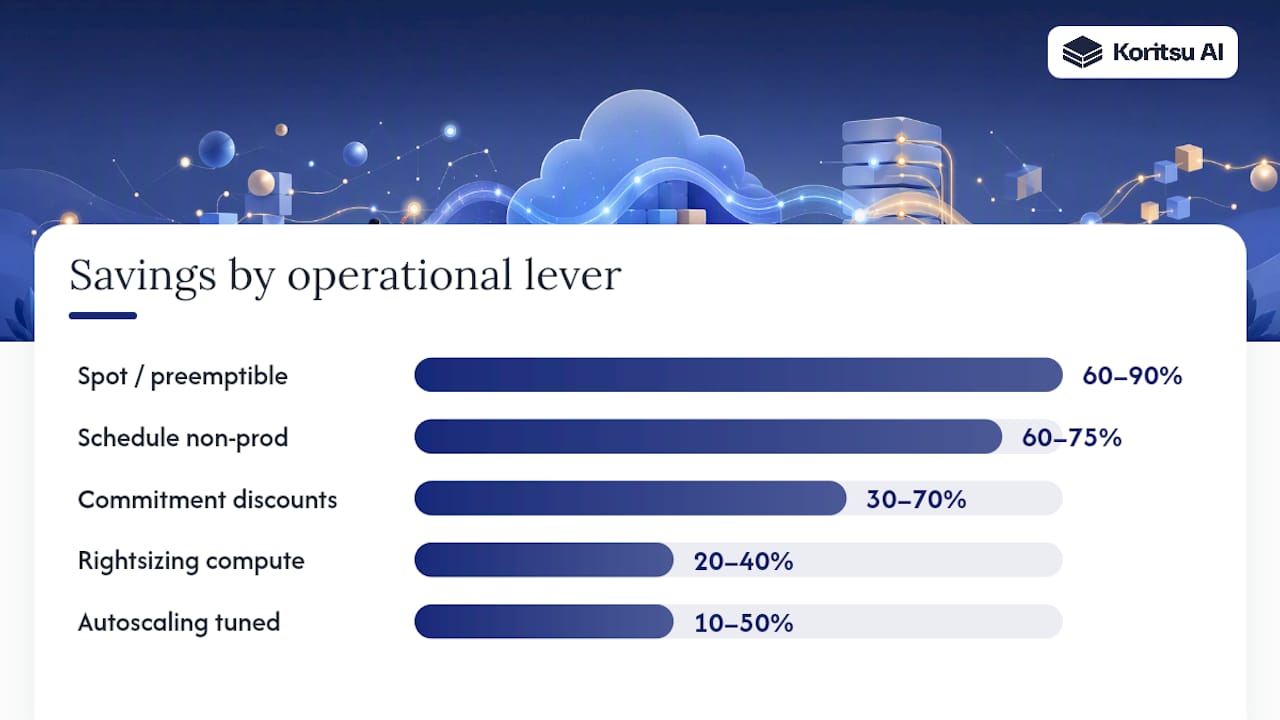
- Rightsizing commonly delivers 20 to 40% savings on the affected compute resources alone, and it’s usually the fastest win available.
- Autoscaling tuned to real traffic patterns rather than static thresholds typically saves 10 to 50%, depending on how variable your workload is.
- Scheduling non-production environments to shut down outside business hours recovers 60 to 75% of that environment’s cost, according to the same Rackspace analysis, and it’s one of the easiest changes to implement.
- Commitment discounts (reserved instances, savings plans, committed use discounts) deliver 30 to 70% off on-demand pricing, but only once you’ve proven a workload’s baseline is stable. Buy commitments too early and you lock in waste rather than savings.
- Spot and preemptible capacity suits interruptible batch or training workloads well, often at 60 to 90% below on-demand rates.
- Storage lifecycle policies that automatically tier cold data to cheaper storage classes, combined with compression, quietly chip away at a bill most teams never revisit after initial setup.
- CDN caching and direct interconnects cut egress costs for data-heavy or geographically distributed workloads.
Pro Tip: Sequence matters. Rightsize and stabilise a workload first, then commit. Committing to an oversized baseline just makes the waste contractual instead of optional.
Governance ties all of this together. Budgets with automated alerts, clear ownership per cost centre, and a monthly review cadence turn one-off savings into a lasting pattern rather than a single good quarter.
A repeatable workflow for analysing cloud spend
You don’t need a quarter-long initiative to get your first real read on spending patterns. This workflow fits inside a month, and most teams can start it this week.
- Collect 30 to 90 days of billing and telemetry data and normalise it into a single schema, whether that’s FOCUS or your own internal standard.
- Compute your unit metrics (cost per inference, cost per transaction, cost per active user) and break total spend down by owner and service.
- Rank two lists: top absolute spend by category, and top growth-by-rate contributors. Check AI, egress, and observability specifically against both lists, since they hide well in absolute terms but stand out in growth rate.
- Prioritise three to five actions, each with an owner, an effort estimate, a timeline, and a projected saving. Run the smallest one first as a proof of value before committing engineering time to the rest.
- Build a one-page summary for finance leadership: total spend, the top three growth drivers, unit economics trends, and the specific actions you’re taking with named owners.
| Analysis stage | What to look at | What good looks like |
|---|---|---|
| Collection | 30 to 90 days of CUR, Cost Export, or Azure billing data | Fully normalised across providers with under 5% untagged spend |
| Measurement | Cost per inference, cost per transaction, cost per user | Unit cost flat or falling as usage grows |
| Driver ranking | AI/GPU, egress, observability against total and growth rate | Named owner for each of the top three growth contributors |
| Action | Three to five prioritised fixes with effort and savings estimates | At least one action already piloted before the full rollout |
This is the same structure behind cloud budget forecasting done properly. You cannot forecast a pattern you’ve never measured, and the AI-driven testing pipelines many engineering teams now run add their own compute and storage load worth including, as analysis of AI tooling in QA workflows has pointed out.
What continuous monitoring changes about spending patterns
A one-off audit finds waste. Continuous analysis catches it forming.
Koritsu AI’s platform, run by our AI agent Kori, watches billing and usage data continuously rather than at the monthly close, and our engineers turn what Kori surfaces into concrete architectural fixes. In practice that has meant rebuilding Lambda invocation patterns and correcting a backup configuration that was quietly duplicating storage costs, work documented in our own case study on a 96% Lambda bill reduction.
Cost drift rarely announces itself. It shows up as a 4% creep this month, another 6% next month, and by the time someone notices, the fix has gone from a config change to a re-architecture.
We only charge a share of savings we actually deliver, starting with a free assessment, which keeps the incentive aligned with results rather than billed hours.
Why the biggest blocker to fixing cloud spend isn’t technical
The hardest part of changing spending patterns is rarely the engineering. It’s the fear that rightsizing will hurt performance, or that commitments will lock a team into an architecture it wants to change. Both concerns are reasonable, and both are usually overstated.
The fix is starting small: pick one low-risk workload, show a measurable saving within weeks, and let that credibility do the persuading. Culture shifts follow evidence, not mandates.
A practical next step for teams ready to act on their spending patterns
Most teams reading this already know their bill has waste in it somewhere. The question is whether you have the engineering time to find it and fix it without pulling people off the roadmap for a quarter. That’s the gap Koritsu AI exists to close: Kori runs continuous analysis across your billing and usage data, and our FinOps specialists turn what it finds into shipped fixes, from rightsizing to the kind of backup misconfiguration that quietly cost one client 15% of a $20k Azure bill.

Engagements start with a free assessment, and we only take a share of the savings we actually verify against your billing data. Teams that want to keep the pattern change going move onto an ongoing subscription for continuous monitoring and hands-on support. If you want a concrete read on where your own bill has drifted, start with a free assessment and see what Kori finds in your first review.
Sources
- How to understand your cloud bill: breaking down the costs | DigitalOcean
- Cloud cost optimisation strategies: the complete 2026 guide | Rackspace Spot
- Reading the cloud bill: explaining mid-year cost growth without excuses | Future of Software