FinOps Inform
Data Transfer Cost Optimization: Find the Flows Behind Your Bill
Trace costly egress with flow telemetry, model alternatives, and verify each change against the bill. Use endpoints, CDN caching, zonal affinity, or interconnect.

Measure flow-level egress first, because a handful of flows usually drive most of your transfer spend. Then stop those bytes crossing billable boundaries: keep traffic in its own zone, send provider traffic through VPC endpoints, cache at a CDN, consolidate NAT paths, and move sustained hybrid volume onto private interconnect. Validate every change by reconciling flow telemetry against your billing exports.
TL;DR:
- Enable flow logs across every account and region, enrich records with application and team tags, then reconcile ranked flows against detailed billing exports.
- Model each major flow across same zone, cross zone, cross region, and internet paths; include charges at both ends and fixed private link fees.
- Prioritize zone affinity, provider endpoints, caching, and NAT consolidation by monthly bytes times boundary rate, while checking cache fill and fallback traffic.
- Choose private interconnect only when sustained monthly savings exceed port and cross connect costs, then test actual routing under load before committing.
- After each change, compare flow telemetry with billing exports and monitor latency, availability, and egress alerts; zonal routing can shift load or trigger failover.
How do you measure and attribute data-transfer costs?
You cannot fix what you cannot attribute. Billing exports tell you that a line item grew; they rarely tell you which conversation between which services caused it. Flow telemetry fills that gap. When VPC or VNet flow logs are enriched with cloud, routing and business context, you can see which applications and destinations drive egress, then rank and validate the most expensive flows for targeted remediation.
Start with the basics across every account and region:
- Enable VPC or VNet flow logs everywhere, not only in production accounts.
- Export detailed billing, such as Cost and Usage Reports, so you can reconcile flows against invoices.
- Enrich each flow record with account, VPC, region, AZ and gateway, plus business tags that map flows to applications, services and teams.
- Use the
DataTransfer-Out-Bytesusage type in Cost and Usage Report records to trend high-transfer services and resources.
Produce three artefacts in the first couple of weeks: a ranked list of expensive flows, a per-application egress baseline, and alert thresholds for egress anomalies. Our guide to engineering-grade cost reporting covers the canonical exports in more detail.
Pro Tip: Tag first, analyse second. A flow that cannot be mapped to a team will never get an owner, and an ownerless flow never gets fixed.
How do you model data transfer before changing the architecture?
Measurement tells you what is happening. Modelling tells you what each alternative would cost before you build it. The AWS guidance on data transfer modelling asks you to identify sources and destinations, classify the data, estimate frequency and size, and compare architecture options at different usage levels.
Work through it in this order:
- List each measured flow with its source, destination, payload size and frequency.
- Record the latency and availability requirements that constrain where each side can live.
- Price the flow on each path: same-AZ, cross-AZ, cross-region and internet egress. Remember that inter-AZ transfers are billed at both ends, so a request crossing zones twice incurs multiple charges.
- If private links are in play, add port fees and commitment costs to the model, not just the lower per-GB rate.
- Write down what each transfer buys: resilience, disaster recovery or latency.
That last step matters more than it sounds. A cross-AZ replication stream that buys real failover is a defensible cost. One that exists because nobody revisited a default is not. Documented outcomes let stakeholders sign off on trade-offs rather than discovering them on the invoice.
Which architecture changes cut egress the most?
Once the ranked list exists, the fixes are usually few and repeatable. AWS Well-Architected guidance recommends CDNs, caching layers, private connections and VPC endpoints as the core toolkit. In practice, we reach for these first:
- Zonal affinity and topology-aware routing. Keep client-to-backend traffic inside one AZ wherever your resilience requirements allow it.
- VPC and VNet endpoints. Send provider service traffic over private paths instead of through NAT or an internet gateway.
- NAT gateway consolidation. NAT gateways carry an hourly charge and a per-GB data processing fee. Placing them in the same AZ as the resources they serve, or replacing NAT paths with endpoints, removes that processing fee.
- CDN and caching. Offload origin egress, but model cache-fill against hit rate. On Google Cloud, for instance, cache fills and transfer out are still metered and vary by destination and tier.
- Compression and incremental sync. Compress replication, logs and telemetry. Prefer change data capture over full replication, since egress fees are fundamentally an architectural issue.
- Transit Gateway and peering review. Remove unnecessary hops that charge you twice for the same bytes.
Pro Tip: Rank fixes by bytes per month multiplied by the per-GB rate of the boundary they cross, not by how elegant the change looks. The dull NAT fix often beats the clever redesign.
For pipeline-heavy estates, our post on data pipeline cost optimisation shows how trimming telemetry volume pays off.
Which routing, load balancer and DNS settings reduce cross-boundary hops?
Load balancers are a quiet source of cross-AZ spend, because cross-zone routing sends requests to targets in other zones whether or not you meant it to. Configuration is the lever here:
- Understand how your NLB or ALB behaves with cross-zone load balancing enabled, and price the consequence of each request that lands in another AZ.
- Enable 100% zonal affinity where your design permits, and size targets in every AZ so that no zone runs short. Under-provisioned zones cause fallbacks, and fallbacks bring the cross-AZ hits straight back.
- In Kubernetes, use topology-aware routing and deliberate node and pod placement so pod-to-service calls stay in-zone.
- After any DNS or load balancer change, verify with flow logs that traffic actually takes the intended path.
That last check is the one teams skip. A setting that is enabled but never exercised under load saves nothing. Our post on load balancer cost optimisation walks through the LCU and cross-AZ mechanics in more depth.
When do private interconnects beat the public internet?
Direct Connect, ExpressRoute and Cloud Interconnect trade a fixed monthly cost for a lower per-GB rate, so they only pay off at sustained volume. Break it down like this:
- Add up the fixed costs: monthly port fees, plus any cross-connect or data centre fees.
- Take your measured sustained volume in GiB per month from flow telemetry, not from an estimate.
- Multiply that volume by the difference between the internet egress rate and the private per-GB rate.
- The break-even is where that monthly saving exceeds the fixed costs. If your volume sits well below it, stay on the public path.
- Validate before committing: route a sample of traffic, measure before and after, and confirm under load that traffic really uses the private path.
Sustained, predictable hybrid traffic is the sweet spot. Bursty or shrinking volume is where these links turn from a saving into a standing charge.
How do you operationalise improvements and verify the savings?
A saving that does not show up on the invoice is a hypothesis. Treat each change as an experiment: set a baseline window, roll out the change, observe, then reconcile.
- Reconcile flow-derived attribution with Cost and Usage Reports so each change produces invoice-level evidence.
- Automate regression alerts for egress increases, and add synthetic tests to catch performance regressions.
- Record an owner, a rollback trigger and a measurement dashboard for every optimisation.
Pro Tip: Fix the observation window before you ship. Choosing it afterwards invites you to pick whichever period flatters the change.
Our write-up on scoring and verifying savings covers the experiment design in detail, and the root cause triage approach helps when the numbers disagree.
How does data transfer optimisation affect application performance and latency?
Most of these changes help performance or leave it alone, but not all. Keeping traffic inside one AZ shortens the network path, so zonal affinity typically lowers latency. VPC endpoints and private links remove hops through NAT and the public internet, which tends to give steadier round-trip times. CDNs and caching serve content nearer the user and take load off origins.
The risks sit on the resilience side. Strict zonal affinity concentrates load, so a zone with too few targets can saturate or fail over badly, and that failover is exactly the cross-AZ traffic you were trying to avoid. Aggressive compression trades CPU for bandwidth, which is a good deal for large payloads and a poor one for tiny, latency-sensitive messages. Consolidating NAT gateways into fewer zones can create a single point of failure and a cross-AZ dependency that did not exist before.
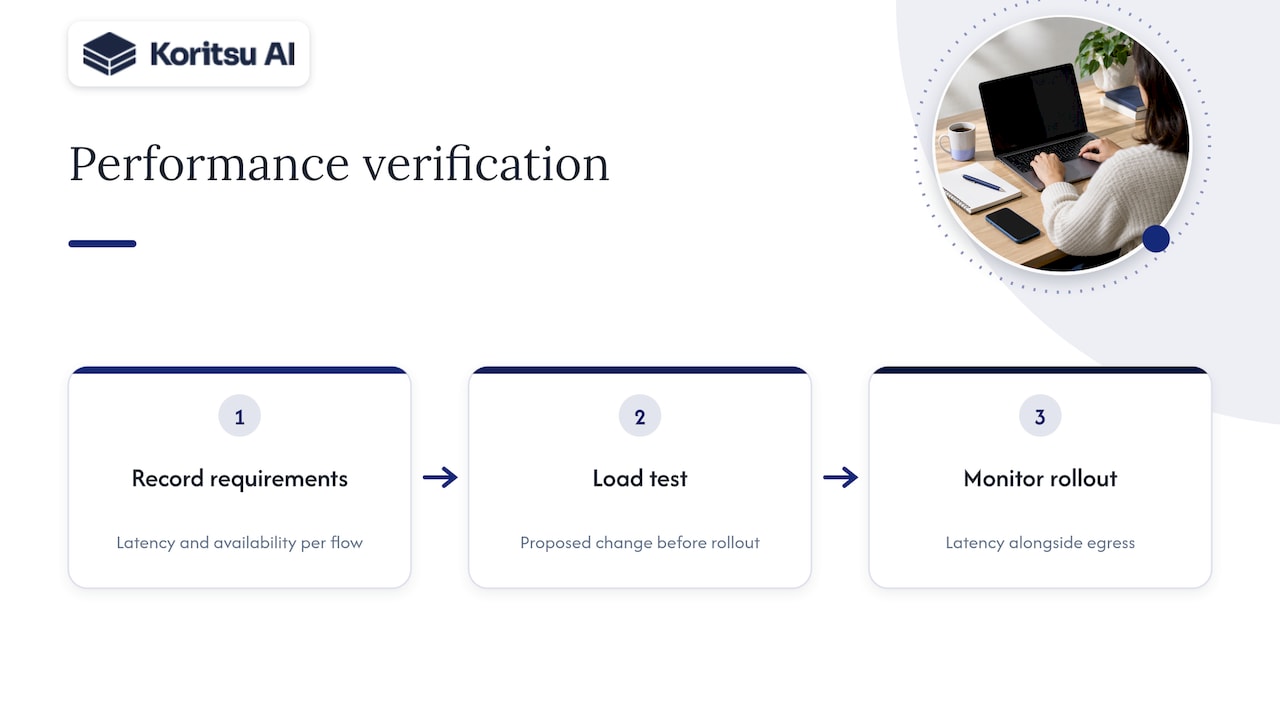
The answer is to treat performance as a constraint in the model, not an afterthought. Record the latency and availability requirement for each flow during planning, load test the change before rollout, and watch latency alongside egress after it ships. The AWS guidance is explicit that every cross-boundary jump introduces billing charges, so balance resilience and cost deliberately rather than by default. A cheaper path that breaches your latency objective is not a saving.
What pitfalls and anti-patterns drive excessive transfer costs?
We see the same handful of mistakes repeatedly, and almost all of them are defaults nobody revisited.
- Everything through NAT. Sending provider service traffic out through a NAT gateway means paying the per-GB processing fee on bytes that could have used an endpoint.
- Chatty cross-AZ microservices. Services spread evenly across zones, calling each other constantly, turn every request into a billable hop.
- Full replication by default. Copying whole datasets between regions on a schedule, when change data capture would move a fraction of the bytes.
- Uncompressed logs and telemetry. Shipping verbose, uncompressed observability data across zones or regions, often at a volume that dwarfs the application traffic it describes.
- Forgotten peering and transit paths. Traffic that hops through several gateways, each charging for the same bytes. Peering that crosses AZs also incurs charges, even where same-zone peering is free.
- Origin-heavy delivery. Serving popular content straight from the origin because nobody put a cache in front of it.
- No ownership. Flows that map to no team, so nobody is accountable when they grow.
The common thread is that these costs are architectural, not accidental. They sit in how the system was built, which is why dashboards alone rarely remove them. Someone has to read the flow data, trace it to a design decision, and change the design.
How do you monitor continuously and govern against cost creep?
Optimisation is not a project with an end date. Traffic grows, services get redeployed into new zones, and a new feature quietly adds a cross-region call. Without governance, savings erode within a few quarters.
Build a small, durable control loop:
- Alerting on egress anomalies. Use the thresholds from your baseline, and route alerts to the owning team rather than a shared inbox.
- Budgets and trend reviews. Use Cost Explorer, AWS Budgets and CloudWatch metrics, as the AWS guidance on monitoring data transfer recommends, and review them on a fixed cadence.
- A purpose-built dashboard. AWS recommends building a data transfer dashboard for visibility into where bytes flow.
- Design review gates. Ask for a transfer estimate whenever a new service, region or integration is proposed, using the modelling method above.
- Pricing-model analysis at account level. Review it at the management-account level, as component selection guidance advises.
- Clear allocation. Charge transfer back to the teams that cause it, so the incentive to fix it sits where the knowledge is.
Cost is a process problem, not a technology problem. The teams that hold their savings are the ones who made egress someone’s recurring responsibility.
Author perspective: why measurement beats guesswork
Most data-transfer advice starts with a list of tactics. We think that gets the order backwards. Tactics are cheap and well known. What is scarce is knowing which two or three flows deserve them. A team that applies every tactic everywhere spends months and moves the bill very little. A team that finds the flows driving most of the spend, fixes them, and proves the result on the invoice can finish sooner.
That is why we pair automated discovery with hands-on engineering. Our AI agent, Kori, surfaces the high-impact flows, and our specialists work with your engineers to change the architecture. We verify each saving by reconciling flow telemetry against your invoices, and we only charge on savings that are realised.
How we help you cut data transfer spend
If you would rather not run this playbook alone, we can do the measuring and the fixing with you. Our free assessment reconciles flow telemetry with your billing to produce a Savings Opportunity Report.
- We start with a free assessment and charge a success fee only on savings verified against your bill.
- Teams ready to act can move onto FinOps as a Service for ongoing monitoring and hands-on execution.
- You can start with Koritsu AI and see where your transfer money goes.
FAQ
How much does it cost for data transfer?
It depends on the boundary the traffic crosses. Ingress is generally free, while cross-AZ and cross-region transfers usually incur charges, as does internet egress. Rates vary by provider, region and destination, so check the provider’s pricing page for your case.
What is a cost optimization strategy?
It is a repeatable method for cutting spend without breaking the service. For data transfer, that means measuring flows, modelling alternatives, fixing the biggest flows, and verifying the saving on the bill. Governance then keeps the savings from eroding.
Is AWS cost optimization free?
AWS provides free guidance, such as the Well-Architected Cost Optimization pillar, and tools like Cost Explorer. Acting on that guidance still takes engineering time. Our own assessment is free, and we charge only a share of savings we actually deliver.
How do you reduce data egress fees?
Stop bytes crossing billable boundaries. Use zone affinity, VPC endpoints, caching and a CDN, and consider private interconnect where volume is sustained. CDNs can also reduce or eliminate some egress fees for cached or partnered patterns.
Sources
- Optimizing data transfer costs when using AWS Network Load Balancer | Networking & Content Delivery
- Cloud Egress Costs: How to Measure, Attribute, and Reduce Them | Kentik
- COST08-BP01 Perform data transfer modeling - Cost Optimization Pillar
- Docs
- Pricing for NAT gateways