FinOps Inform
Cloud cost attribution methods: practical examples for FinOps teams
Explore practical examples of cloud cost attribution methods to help FinOps teams optimize costs, enhance accuracy, and make informed decisions.

Cloud cost attribution is the practice of identifying which team, product, or customer owns a given cloud charge, and the method you choose determines whether that data is trustworthy enough to act on. The five core approaches are: direct allocation (dedicated resources tagged to a single owner), proportional allocation (shared costs split by usage telemetry such as CPU-hours or GB transferred), activity-based allocation (charges driven by transaction or request counts), weighted or even-split allocation (a fallback where telemetry is unavailable), and virtual rules-based allocation (policy-driven mapping for untagged or legacy resources). Understanding the distinction between attribution and allocation matters here: attribution is the data layer that identifies an owner; allocation is the financial action, whether showback or chargeback, performed on that data.
Who benefits most from each method:
- Direct allocation suits any resource with a single, identifiable owner: a dedicated EC2 instance, an RDS cluster, or a storage bucket tied to one team.
- Proportional allocation is the right choice for shared services where usage telemetry exists, such as Transit Gateway data processing, shared Kubernetes clusters, or multi-tenant databases.
- Activity-based allocation fits API gateways, Lambda invocations, and any service where request or transaction counts are the clearest proxy for consumption.
- Weighted or even-split allocation is a pragmatic fallback for security tooling, logging infrastructure, or any platform service where granular telemetry is not yet available.
- Virtual rules-based allocation closes the gap for legacy accounts, untagged resources, or marketplace charges that cannot be retroactively tagged.
For shared services and commitments: use proportional splits where usage telemetry exists; use weighted or even-split only where it does not. For Reserved Instances and Savings Plans, present both amortised and effective views so finance can reconcile internal chargebacks with actual invoices.
One operational rule overrides everything else: run showback first. Move to chargeback only when your tag coverage is stable, your allocation maths are documented, and you have a dispute process in place. Organisations that skip this step find that chargeback creates conflict rather than accountability.
Key takeaways
Direct allocation is the most accurate and least complex method; proportional allocation is the right choice for shared services where usage telemetry exists; and virtual rules-based allocation is the necessary fallback for untagged or legacy resources.
| Point | Details |
|---|---|
| Choose the method by telemetry availability | Use direct allocation for dedicated resources, proportional where usage metrics exist, and weighted or virtual rules where they do not. |
| Showback before chargeback | Run at least one full billing cycle of showback reports and validate reconciliation before connecting allocations to team budgets. |
| Enforce tags at provisioning time | AWS Tag Policies, Azure Policy deny rules, and IaC guardrails deliver materially higher coverage than retroactive tagging programmes. |
| Shared costs need documented formulas | Publish the allocation maths for every shared service and assign a dispute SLA so teams can verify and challenge their charges. |
| Koritsu AI free assessment | Koritsu AI maps tag coverage, identifies shared-cost drivers, and produces a prioritised allocation roadmap at no upfront cost. |
What are the main cloud cost attribution methods, with examples?
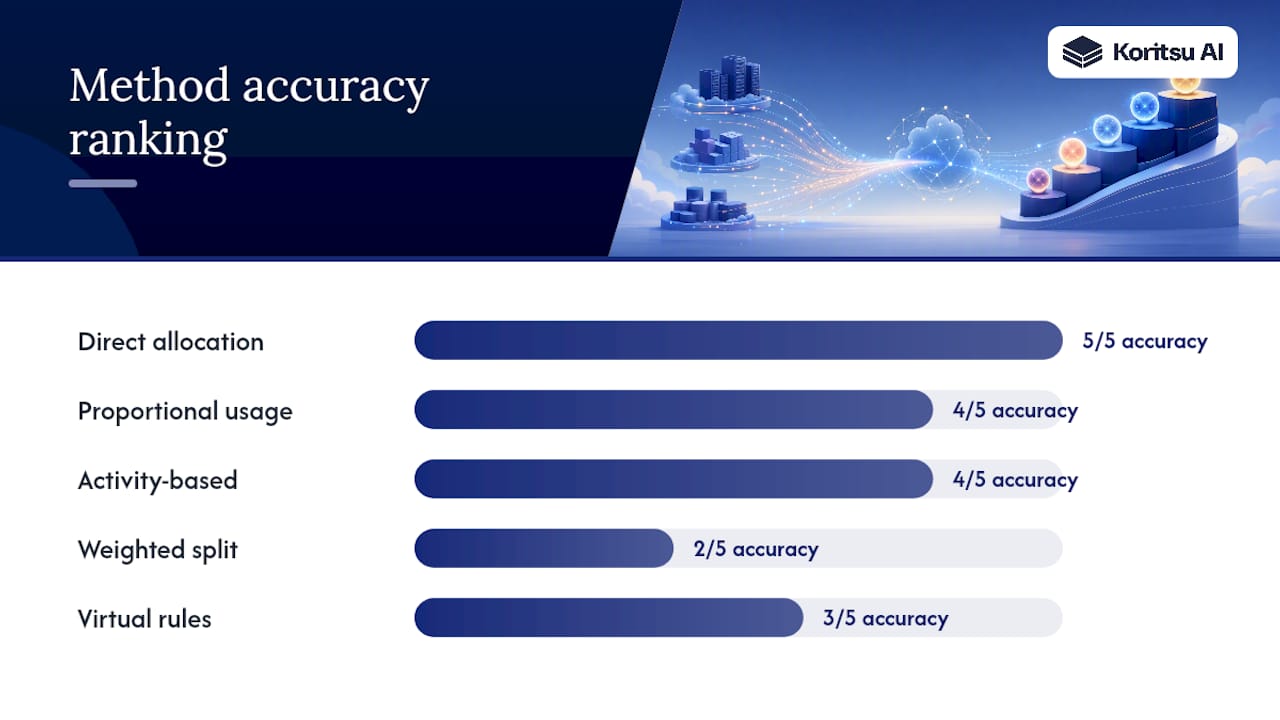
The five methods below cover the vast majority of cloud estates. Each has a distinct accuracy profile, a complexity cost, and a natural home in your billing data.
| Method | Accuracy | Complexity | Best-fit use case | Telemetry / metric required |
|---|---|---|---|---|
| Direct allocation | Highest | Low | Dedicated resources with a single owner | Resource tag (owner, cost-centre) |
| Proportional (usage-based) | High | Medium | Shared services with measurable consumption | CPU-hours, GB transferred, request count |
| Activity-based | High | Medium–High | API gateways, Lambda, per-transaction services | Request count, invocation count, token/GPU-hours |
| Weighted / even split | Low–Medium | Low | Security tooling, logging, platform services without telemetry | Headcount, resource count, or equal share |
| Virtual rules-based | Medium | Medium | Legacy accounts, untagged resources, marketplace charges | Account ID, service name, resource name pattern |
Direct allocation
A dedicated EC2 instance tagged team: payments and env: production maps its entire cost to the payments team with no maths required. Pull the AWS Cost & Usage Report (CUR), filter by tag, and sum the UnblendedCost column. The same logic applies to Azure resources filtered in Azure Cost Management by resource tag, or to GCP resources queried from the billing export in BigQuery. Direct allocation is the most defensible method precisely because there is no formula to dispute.
Proportional allocation
Transit Gateway data processing is billed to the central networking account, not to the spoke accounts that generated the traffic. The correct approach is to pull CloudWatch NetworkIn and NetworkOut metrics per attachment, calculate each spoke's share of total bytes, and apply that proportion to the central CUR line item. AWS documents this Transit Gateway proportional chargeback pattern in detail, and the worked numerical example in a later section reproduces the calculation.
Activity-based allocation
An API Gateway serving three product teams processes 10 million requests per month: Team A sends 6 million, Team B sends 3 million, Team C sends 1 million. This method works well for microservices cost attribution where request counts are already captured in access logs or APM tooling. For AI workloads, token counts or GPU-hours replace request counts as the allocation driver.
Weighted or even-split allocation
A shared GuardDuty or Security Hub deployment protects every account equally. Document the weighting formula in your allocation playbook so stakeholders can verify it. This is a pragmatic approach, not a precise one, and it should be replaced with telemetry-driven splits as soon as a meaningful usage signal becomes available.
Virtual rules-based allocation
Legacy accounts and marketplace charges frequently arrive without tags. A virtual tag rule maps account-id: 123456789 to owner: platform-engineering without touching the resource itself. AWS Cost Categories and Azure Cost Management's custom grouping features both support this pattern. The FinOpsForge practical guide notes that retroactive tagging programs rarely exceed roughly 70% coverage, which is why virtual rules are a necessary complement rather than a temporary workaround.
How should you handle tagging and metadata for reliable attribution?
Tags are the foundation of direct and proportional allocation. Without them, you are left with virtual rules and even-splits for the majority of your estate, which means lower accuracy and more disputes.
Essential tags every resource should carry
ownerorteam: the engineering team or squad responsible for the resource. Without this, no allocation method can assign costs to a human who can act on them.productorservice: the product or microservice the resource supports. Enables cost-per-feature reporting and product-level P&L views.environment:production,staging,development. Separates cost centres and prevents dev spend from inflating production budgets.cost-centre: the finance code that maps to your chart of accounts. Finance teams need this to reconcile cloud invoices with internal budgets.customer-id: for multi-tenant SaaS platforms where per-customer attribution is required. When tags alone are insufficient, runtime traffic analysis or application instrumentation can attribute shared services such as RDS or Kafka back to individual customers, as documented in per-customer attribution approaches.
Governance controls that actually work
Enforcing tags at provisioning time is categorically more effective than fixing them retroactively. Azure Policy can deny resource creation if required tags are absent or non-compliant, delivering higher and more stable coverage from day one. On AWS, Service Control Policies and AWS Tag Policies enforce the same constraint at the organisation level. On GCP, organisation policies and label constraints apply equivalent controls.
Embed tag requirements into your infrastructure-as-code templates. A Terraform module that requires var.team and var.cost_centre as non-optional inputs means tags travel with the resource from the first terraform apply. Tools such as Infracost integrate with CI pipelines to surface cost estimates pre-deployment and can flag missing cost metadata before a pull request merges.
Pro Tip: Set up a weekly automated report that shows tag coverage percentage by account or subscription. A coverage regression of more than five percentage points in a week is a reliable signal that a new deployment bypassed your enforcement controls.
When to use virtual tags instead of retroactive tagging
Virtual tags are preferable to retroactive tagging when: the resource is in a legacy account where IaC is not yet in use; the charge comes from a third-party marketplace listing that does not support custom tags; or the resource is ephemeral and short-lived (Lambda invocations, Fargate tasks) where tag propagation is inconsistent. Virtual rules in AWS Cost Categories or Azure Cost Management's custom grouping let you assign ownership without modifying the resource, and they apply retroactively to historical billing data.
How do you allocate shared services, commitments, and discounts?
Without them, those costs either sit in a central bucket that nobody owns or get absorbed by whichever team happens to be billed for the shared account.
Shared services: proportional versus central absorption
The right approach depends on whether a meaningful usage signal exists. If it does, proportional allocation is more defensible and creates better incentives: teams that consume more pay more, which discourages waste. If no telemetry differentiates consumption, central absorption (the platform team absorbs the cost) is often more practical than an arbitrary even-split, particularly for low-value shared services where the administrative overhead of splitting exceeds the benefit.

The FinOps Foundation's shared cost working group recommends documenting the allocation method and review cadence for every shared service, so that stakeholders understand the basis for their charges and can challenge the formula if it becomes inaccurate.
Commitments: Reserved Instances and Savings Plans
Reserved Instances and Savings Plans create a mismatch between who purchased the commitment and who consumed the discount. Two approaches are common:
- Amortised allocation: spread the upfront or recurring commitment cost across the billing period and allocate the amortised daily rate to whichever team consumed the discounted usage. AWS CUR provides both
UnblendedCost(on-demand equivalent) andAmortizedCostcolumns for this purpose. - Internal custom rules: the central FinOps team purchases commitments and resells capacity to teams at a negotiated internal rate, often slightly below on-demand. This requires a separate internal billing process but gives teams predictable costs.
Present both amortised and effective (post-discount) views side by side so finance can reconcile internal chargebacks with the actual AWS, Azure, or GCP invoice. Mismatches between the two views are a common source of finance disputes.
Worked example: Transit Gateway proportional allocation
AWS Transit Gateway data processing charges accumulate in the central networking account. To split them proportionally:
| Input | Value |
|---|---|
| Total TGW data processing cost (month) | £420 |
| Team A NetworkIn + NetworkOut (GB) | 600 GB |
| Team B NetworkIn + NetworkOut (GB) | 300 GB |
| Team C NetworkIn + NetworkOut (GB) | 100 GB |
| Total bytes across all attachments | 1,000 GB |
Team A's share: 600 ÷ 1,000 × £420 = £252. Team B's share: 300 ÷ 1,000 × £420 = £126. Team C's share: 100 ÷ 1,000 × £420 = £42.
The CloudWatch metrics (NetworkIn, NetworkOut per attachment) are joined to the CUR line item via an Athena query, as described in the AWS Transit Gateway chargeback reference architecture. The query groups by attachment ID, calculates each attachment's byte share, and multiplies by the total cost from the CUR lineitem_unblendedcost column.
Which tools and data sources power cloud cost attribution?
Attribution requires two data streams: billing exports (what was charged) and usage telemetry (who consumed it). The native provider tools cover both, but joining them reliably requires a small data pipeline.
| Provider | Billing export | Usage telemetry | Query / reporting layer |
|---|---|---|---|
| AWS | Cost & Usage Report (CUR) to S3 | CloudWatch metrics, Split Cost Allocation Data (ECS/EKS) | Amazon Athena, AWS Cost Explorer |
| Azure | Cost Management export to Blob Storage | Azure Monitor metrics, Azure Policy compliance data | Cost Management + Power BI, or Databricks |
| GCP | Billing export to BigQuery | Cloud Monitoring metrics, GKE usage metering | BigQuery SQL, Looker Studio |
AWS: CUR, Cost Explorer, and CloudWatch
The CUR is the most granular billing source AWS provides. It includes resource-level line items, tag columns, amortised cost columns, and Split Cost Allocation Data for ECS and EKS workloads. Cost Explorer offers a UI and API for filtered views and is sufficient for direct allocation reporting. For proportional splits, you need Athena queries that join CUR line items to CloudWatch metric exports. AWS Cost Categories let you define virtual tag rules that apply across the CUR without modifying resources.

Azure: Cost Management and Azure Policy
Azure Cost Management exports billing data to Blob Storage in CSV or Parquet format. The export includes resource tags, subscription, resource group, and service name. Azure Policy enforces tag compliance at provisioning time, which directly improves the quality of the billing export. For Kubernetes workloads on AKS, Azure Cost Management integrates with OpenCost to provide namespace-level allocation.
GCP: billing export and BigQuery
GCP's billing export to BigQuery is the most query-friendly native billing source across the three major providers. Labels (GCP's equivalent of tags) appear as columns in the export, and standard SQL queries can aggregate costs by label, project, or service. For GKE workloads, GCP's usage metering and OpenCost provide pod and namespace-level attribution.
Multi-cloud normalisation
UK enterprises running workloads across two or more providers need a normalisation layer that maps provider-specific concepts (AWS accounts, Azure subscriptions, GCP projects) to a common cost-centre hierarchy. A typical pipeline exports billing data from each provider to a central data lake (S3, Azure Blob, or Google Cloud Storage), transforms it into a common schema, and loads it into a query engine such as Databricks or BigQuery for unified reporting. For cloud spend per service reporting across providers, this normalisation step is non-negotiable.
How do you implement cloud cost attribution step by step?
The sequence below reflects the order in which dependencies resolve. Skipping steps creates rework: you cannot automate allocation before you have telemetry, and you should not run chargeback before you have validated outputs.
- Audit existing billing data and tags (1–2 weeks). Pull a CUR or Cost Management export for the last 90 days. Calculate tag coverage by resource type and account. Identify the top 20 cost drivers and check whether each has an owner tag. This baseline tells you where to focus governance effort first.
- Define your allocation policy and cost-centre hierarchy (1–2 weeks, concurrent with step 1). Decide which method applies to each resource category: direct for dedicated resources, proportional for shared services with telemetry, weighted for those without. Document the formula for every shared service. Agree the cost-centre hierarchy with finance so that cloud cost-centres map to the chart of accounts.
- Instrument telemetry for shared services (2–6 weeks). Enable CloudWatch metric exports for Transit Gateway, NAT Gateway, and shared databases. Enable Split Cost Allocation Data in AWS for ECS and EKS clusters. For multi-tenant services, evaluate whether application instrumentation or runtime traffic analysis is needed to reach customer-level granularity.
- Enforce tagging at provisioning time (4–8 weeks). Update IaC modules to require mandatory tag variables. Apply AWS Tag Policies or Azure Policy deny rules. Run Infracost or equivalent tooling in CI to flag missing cost metadata before deployment. Set a target tag coverage threshold (typically 90%+) as an acceptance criterion.
- Pilot showback for one platform or team (1–3 months). Generate weekly allocation reports for a single team or product. Share the reports, explain the allocation maths, and invite challenges. This is the step where you discover gaps in your telemetry joins and errors in your virtual tag rules before they affect budgets.
- Validate outputs and sign off acceptance criteria. Before moving to chargeback, confirm: tag coverage is at or above your threshold; every shared service has a documented allocation formula; at least one full billing cycle of reconciled reports has been reviewed by both engineering and finance; and a dispute SLA is in place (typically 5–10 business days).
- Move to chargeback and automate (ongoing). Once acceptance criteria are met, connect allocation outputs to your internal billing or budgeting system. Automate the weekly reconciliation report. Set alerts on tag coverage regression and anomalous shared-service cost spikes.
The FinOps Foundation's framework phases (Inform, Optimise, Operate) map directly to this sequence: steps 1–3 are Inform, steps 4–5 are Optimise, and steps 6–7 are Operate.
Worked numerical examples you can reproduce
Example 1: direct allocation for EC2 and EBS
You have three EC2 instances and their attached EBS volumes in a single AWS account. Each resource carries an owner tag.
Athena query (pseudocode against CUR):
SELECT
  resource_tags_user_owner AS owner,
  SUM(line_item_unblended_cost) AS total_cost
FROM cur_table
WHERE line_item_usage_start_date >= '2026-05-01'
  AND line_item_usage_start_date < '2026-06-01'
GROUP BY resource_tags_user_owner
ORDER BY total_cost DESC;
Result: checkout = £225, search = £39. No proportional maths required; the tag does all the work.
Example 2: Transit Gateway proportional split
Using the inputs from the shared services section above, the Athena join pseudocode looks like this:
-- Step 1: get total TGW cost from CUR
SELECT SUM(line_item_unblended_cost) AS tgw_total_cost
FROM cur_table
WHERE line_item_product_code = 'AmazonVPC'
  AND line_item_operation = 'TransitGatewayProcessing';

-- Step 2: get bytes per attachment from CloudWatch export
SELECT attachment_id, SUM(bytes_in + bytes_out) AS total_bytes
FROM cloudwatch_tgw_metrics
GROUP BY attachment_id;

-- Step 3: proportional allocation
SELECT
  a.attachment_id,
  a.total_bytes / t.grand_total_bytes * c.tgw_total_cost AS allocated_cost
FROM attachment_bytes a
CROSS JOIN (SELECT SUM(total_bytes) AS grand_total_bytes FROM attachment_bytes) t
CROSS JOIN (SELECT tgw_total_cost FROM tgw_cost) c;
The output matches the table in the shared services section: Team A £252, Team B £126, Team C £42. This approach follows the AWS reference architecture for Transit Gateway chargeback and can be scheduled as a weekly Athena query with results written to S3 for downstream reporting.
For multi-tenant services where billing exports and tags cannot capture consumption at customer granularity, runtime traffic analysis or application instrumentation provides the additional signal needed to attribute shared RDS, Kafka, or Elasticsearch costs back to individual customers.
What are the most common attribution pitfalls, and how do you fix them?
Most attribution programmes fail not because the maths is wrong but because the operational discipline breaks down after the initial setup.
- Tag drift and low coverage. Tags degrade over time as teams provision resources manually or bypass IaC. Enforce tags at CI/CD using AWS Tag Policies or Azure Policy deny rules, and alert on coverage regression. Retroactive tagging rarely exceeds roughly 70% coverage; enforcement at provisioning time is the only reliable fix.
- Orphaned and marketplace charges. Resources that outlive their owning team, and marketplace listings that do not support custom tags, accumulate in a "no owner" bucket. Assign a neutral holding cost-centre for truly unallocatable costs, review it monthly, and use virtual tag rules to reassign charges as ownership is clarified.
- Disputes over shared-cost maths. Teams that do not understand the allocation formula will challenge the numbers. Publish the allocation maths in a shared document, assign a dispute SLA (5–10 business days is typical), and send reconciled reports weekly. A defensible allocation programme publishes the formula, assigns a dispute SLA, and auto-sends reconciled reports to stakeholders.
- Commitment mis-allocation. Savings Plans and Reserved Instances applied to the wrong team's usage create chargebacks that do not reflect actual consumption. Present both amortised and effective cost views in every chargeback report so finance can verify the reconciliation.
- Kubernetes opacity. Pod and namespace costs are not visible in standard billing exports. Enable AWS Split Cost Allocation Data for ECS and EKS, or deploy OpenCost for AKS and GKE, to get namespace-level attribution before attempting Kubernetes chargeback.
Pro Tip: Set a weekly alert on your tag coverage metric. If coverage drops below your agreed threshold, pause chargeback for the affected accounts until the gap is closed. Charging teams for costs they cannot verify destroys trust in the entire programme.
Koritsu AI's recommended maturity approach
The maturity path for cloud cost attribution follows four stages, and the order matters.
- Discovery. Audit billing exports, identify the top cost drivers, and measure baseline tag coverage. This is the Inform phase: you cannot allocate what you cannot see.
- Enforced tags and telemetry. Apply IaC guardrails, tag policies, and CloudWatch or Azure Monitor metric exports. Target 90%+ tag coverage before moving further.
- Automated allocations. Build the Athena or BigQuery queries that join billing to telemetry. Automate virtual tag rules for untagged resources. Generate weekly showback reports.
- Chargeback governance. Publish the allocation playbook, agree the dispute SLA with finance, and connect allocation outputs to internal budgeting systems. Only at this stage should costs flow to team budgets.
Koritsu AI recommends showback for at least one full billing cycle before chargeback. The reason is practical: showback surfaces errors in your telemetry joins and virtual tag rules without the political cost of incorrect charges hitting team budgets. Validate that your allocated totals reconcile with the provider invoice before you charge anyone.
Pro Tip: Before your first chargeback run, pick one team and walk through their allocation report line by line with them. If they can explain every charge, your programme is ready. If they cannot, your allocation maths or tag coverage needs more work.
For teams that want to accelerate this process, Koritsu AI offers a free assessment that maps your current tag coverage, identifies the top shared-cost drivers, and produces a prioritised allocation roadmap. It is a useful starting point before committing engineering time to a full implementation.
The mistake most teams actually make
The most common failure in cloud cost attribution is not technical. It is organisational.
Teams rush to chargeback because finance wants cost accountability, and they skip the showback phase entirely. The result is predictable: engineering teams receive charges they cannot explain, disputes pile up, and the FinOps programme loses credibility with the very stakeholders it was meant to serve.
The second mistake is treating attribution as a one-time project rather than an ongoing process. Tags drift. New services appear. Shared platforms change their consumption patterns. An allocation model that was accurate in January may be materially wrong by June if nobody is monitoring coverage or reviewing the allocation formulas.
The fix is not more tooling. It is a documented allocation playbook that engineering and finance own jointly, a regular review cadence, and a clear dispute process. The FinOps Foundation framework describes this as the Operate phase, and it is where most organisations stall. Getting to Operate requires treating attribution as product engineering work: embed cost metadata at CI/CD, assign ownership, and review the outputs on the same cadence as any other operational metric.
Finance and engineering need to build the allocation playbook together. Finance understands the chart of accounts and the reconciliation requirements. Engineering understands which telemetry signals are reliable and which are not. Neither team can build a workable chargeback model without the other.
How Koritsu AI can accelerate your attribution programme
Most attribution programmes stall at the same point: the team has billing exports and some tags, but the shared-cost splits are manual, the virtual tag rules are inconsistent, and the showback reports are not trusted by the teams receiving them.

Koritsu AI combines a continuously running AI platform with hands-on FinOps expertise to move you past that stall point. The platform ingests CUR, Azure Cost Management exports, and GCP BigQuery billing data, applies virtual tagging rules, builds shared-cost drivers from CloudWatch and Azure Monitor telemetry, and produces automated showback and chargeback exports that reconcile with your provider invoices. Kori, the AI agent, surfaces anomalies and coverage regressions before they affect your chargeback run. The FinOps specialists help you build the allocation playbook, validate the maths with finance, and run the dispute process.
The engagement starts with a free assessment: bring your last 90 days of billing exports and a short inventory of your shared services, and Koritsu AI will map your tag coverage, identify the top unallocated cost drivers, and produce a prioritised attribution roadmap. There is no upfront fee. Koritsu AI charges a share of the savings it finds. To book your free assessment, visit Koritsu.
Sources
The sources below are the primary references for the methods, tools, and governance guidance covered in this article.