FinOps Inform · Cost Assessment
What is cloud cost assessment? A guide for 2026
Discover what is cloud cost assessment and how it helps optimize your cloud spending. Learn strategies for effective financial accountability in 2026.

A cloud cost assessment is the systematic examination of billing, usage, and pricing data to identify where cloud spend originates, why it grows, and where optimisation opportunities exist. For cloud engineers and financial decision-makers, it is the foundational practice that makes every other cost reduction effort possible. Without it, you are making budget decisions based on aggregate invoices rather than granular evidence. The FinOps Foundation defines this visibility layer as the prerequisite for any meaningful financial accountability across engineering and finance teams.
What does a cloud cost assessment actually cover?
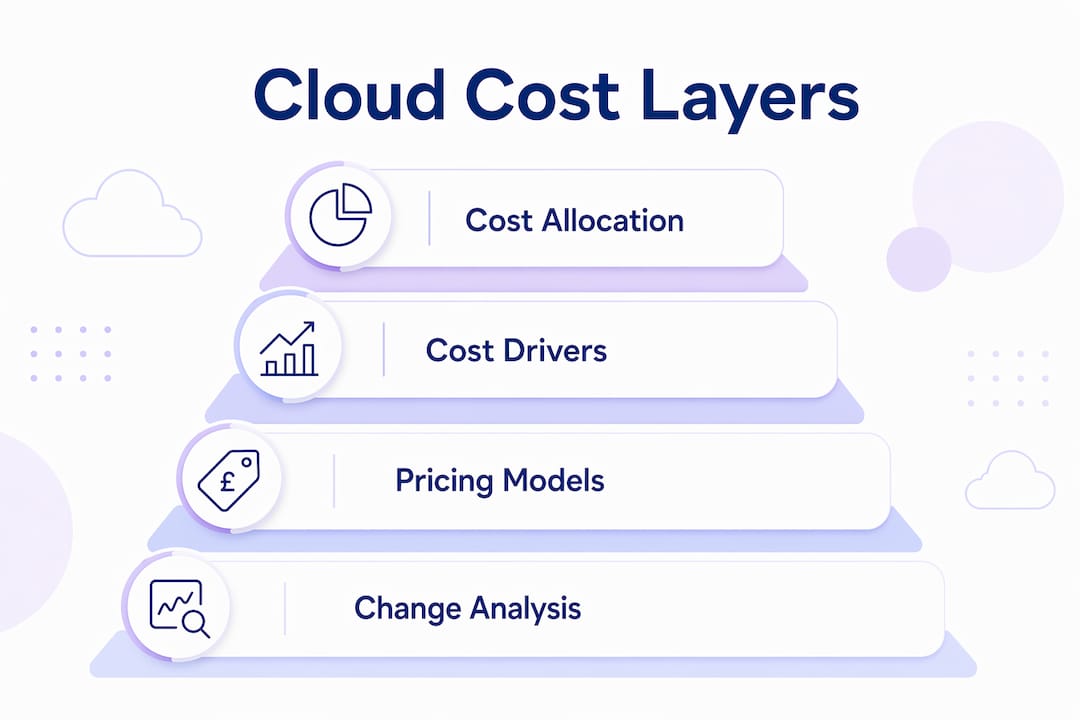
Cloud cost assessment involves examining four interconnected layers of cloud spend: cost allocation, cost drivers, pricing models, and change analysis. Each layer answers a different question, and together they give you a complete picture of where money is going and why.
Cost allocation maps spend to the organisational units that generate it. This means tagging resources by team, product, environment (production versus staging), and cost centre. Without this layer, you cannot hold any team accountable for its share of the bill.
Cost drivers are the services consuming the most budget. Compute, storage, data transfer, and managed services such as Kubernetes clusters are the usual culprits. Identifying which workloads drive the largest costs tells you where rightsizing or architectural changes will have the greatest impact.

Pricing models determine how much you pay per unit of consumption. The three primary models on AWS, Google Cloud, and Azure are on-demand pricing, Reserved Instances or committed use discounts, and spot or preemptible instances. A cost assessment surfaces whether your current mix of pricing models matches your actual usage patterns.
Change analysis tracks how costs shift over time. This includes anomaly detection, inefficiency pattern identification, commitment drift (where reserved capacity no longer aligns with actual workloads), and forecasting variance. Cloud inefficiency accounts for roughly 30 to 35% of enterprise cloud spend, which means change analysis alone can surface material savings.
Pro Tip: Before running any cost assessment, agree on your cost taxonomy first. Define the tag keys, values, and ownership rules that will govern your entire analysis. A randomly tagged environment produces misleading averages, not actionable data.
How does cloud cost assessment fit within FinOps?
The FinOps framework defines cloud financial management as an operational and cultural practice that maximises business value by connecting finance, engineering, and business teams around shared cost data. A cloud cost assessment is the inform and visibility step within that framework. It is the data layer that makes every downstream decision possible.
Without a structured assessment, FinOps conversations stall. Finance teams see a total invoice. Engineering teams see resource utilisation metrics. Neither group has the shared, attributed cost data needed to agree on priorities or trade-offs. The assessment closes that gap.
Here is how a well-executed assessment drives FinOps maturity across an organisation:
- Establish visibility. Produce a tagged, allocated view of spend that every stakeholder can interrogate. This is the single source of truth for cost conversations.
- Assign ownership. Map costs to the teams and products that generate them. Ownership without data is meaningless; data without ownership changes nothing.
- Enable decision-making. Give engineering leads the cost context they need to prioritise architectural changes. Give finance leads the granularity they need to build accurate forecasts.
- Separate reporting from steering. A monthly cost report describes what happened. A continuous assessment practice steers what happens next. The distinction matters because cloud environments change daily.
- Drive continuous optimisation. Cost transparency from assessment enables ownership and accountability, which is the engine of ongoing FinOps improvement rather than a one-time exercise.
The practical implication is that cloud cost assessment is not a quarterly audit. It is a continuous process that feeds real-time data into engineering and financial planning cycles.
What tools and methods make cloud cost assessments effective?
Effective cloud cost assessments rely on a combination of tagging discipline, provider-native tooling, and unit economics metrics. The method you choose depends on your cloud provider, your organisational structure, and the granularity you need.
AWS Cost Allocation Tags and Cost Categories are the foundation for any AWS-based assessment. Cost Allocation Tags add metadata to resources at the point of creation. Cost Categories then group tagged resources into logical buckets that map to your internal cost centres. AWS Cost Explorer and AWS Budgets consume this metadata to produce the attributed spend views your finance team needs for chargeback and showback models.
For workload-specific assessments, parameterised dashboards provide estimated total cost of ownership for a defined scope. Commvault's cost assessment dashboards for cloud backup, for example, model storage retention costs and workload licensing fees against actual usage inputs. This approach is particularly useful when you need to assess the cost of a specific solution rather than your entire cloud estate.
For dynamic environments running Kubernetes or serverless workloads, standard billing data arrives too late to be useful for real-time decisions. Dynatrace OneAgent integrates cost allocation tags from Kubernetes telemetry directly, providing contextual cost visibility without waiting for the next billing cycle.
Unit economics metrics are the most actionable output of any assessment. Cost per request, cost per user, and cost per API call reveal non-linear scaling behaviour that aggregate spend figures hide entirely. Requests might increase by 30% while infrastructure spend rises by 70%. That divergence is invisible in a total cost view but immediately obvious in a unit cost view. See our guide on cloud cost per feature for a practical framework engineering teams can apply directly.
Pro Tip: Automate tag enforcement using infrastructure-as-code policies or cloud provider governance tools such as AWS Config rules or Azure Policy. Manual tagging compliance rates degrade quickly as environments scale. Automation is the only way to maintain assessment accuracy at pace.
The following table summarises the primary tooling options by use case:
| Use case | Recommended tooling |
|---|---|
| Cost allocation across teams | AWS Cost Allocation Tags, AWS Cost Categories, Azure Cost Management |
| Workload-specific TCO modelling | Commvault cost dashboards, custom parameterised models |
| Dynamic environments (Kubernetes) | Dynatrace OneAgent with cost metadata, Kubecost |
| Unit economics tracking | Custom dashboards in Grafana, CloudWatch metrics with cost correlation |
| Anomaly detection and change analysis | AWS Cost Anomaly Detection, Koritsu AI continuous monitoring |
How do you turn assessment results into budgeting and optimisation decisions?
Raw assessment data does not drive decisions. Interpreted assessment data does. The translation step is where most organisations lose value from their cloud cost analysis work.
- Define decision-ready KPIs. Cost per workload, cost per active user, and cost per API call are the metrics that connect engineering behaviour to financial outcomes. Aggregate spend figures tell you the total; unit metrics tell you whether you are getting more or less efficient as you scale.
- Identify commitment optimisation opportunities. Once you have identified stable workloads through change analysis, you can model the savings available from Reserved Instances or Savings Plans. Commitment optimisation can yield savings of 30 to 66% on those workloads once usage patterns are well understood.
- Apply chargeback or showback models. Assessment results feed directly into internal billing models. Chargeback allocates actual costs to business units. Showback shows teams their costs without transferring the charge. Both require accurate attribution data to function correctly.
- Account for commitment attribution drift. Savings Plans and Reserved Instances are consumed by whichever workload runs on the underlying capacity, which may not be the team that purchased the commitment. Without internal allocation rules that correct for this, team-level cost reports become inaccurate and trust in the chargeback model erodes.
- Connect to financial planning cycles. Assessment results should feed quarterly budget reviews and annual planning. Cloud cost growth is rarely linear. A workload that cost £50,000 per month in Q1 may cost £90,000 in Q3 following a feature release. Continuous assessment data makes those inflection points visible before they become budget surprises.
The comparison below illustrates the difference between assessment-informed and uninformed budgeting approaches:
| Budgeting approach | Data source | Accuracy | Optimisation potential |
|---|---|---|---|
| Aggregate invoice review | Monthly cloud bill totals | Low | Minimal |
| Tagged cost allocation | Cost Explorer with allocation tags | Medium | Moderate |
| Unit economics with change analysis | Granular metrics plus anomaly detection | High | Significant |
What are the common challenges in maintaining accurate cloud cost assessments?
Getting a cloud cost assessment right once is achievable. Keeping it accurate as your environment evolves is the harder problem. These are the challenges that consistently undermine assessment quality in practice.
- Tagging adherence degrades over time. New resources are deployed without tags. Teams change. Products are renamed. Without automated enforcement, a well-defined cost taxonomy deteriorates into a patchwork of inconsistent labels that produces unallocated spend and misleading averages.
- Cost taxonomy misalignment precedes analysis failures. If your tag structure does not map to your organisational cost centres, no amount of tooling will produce accurate attribution. Taxonomy design is a prerequisite, not an afterthought.
- Dynamic environments outpace static billing data. Kubernetes pods, serverless functions, and auto-scaling groups create and destroy resources faster than monthly billing cycles can track. Real-time cost metadata at the telemetry layer is the only reliable solution for these environments.
- Discount attribution drift corrupts team-level visibility. As noted above, commitment instruments like Savings Plans do not always benefit the team that purchased them. Without governance rules that redistribute savings correctly, chargeback models generate disputes rather than accountability.
- Misleading averages obscure real cost behaviour. Averaging costs across a mixed workload portfolio hides the outliers that represent the largest optimisation opportunities. Granular segmentation by workload type, environment, and team is the antidote. You can explore how anomaly detection surfaces these outliers before they compound.
The underlying theme across all of these challenges is that cloud cost assessment is not a technology problem. It is a process problem. The tools exist. The discipline to apply them consistently is what separates organisations that control their cloud costs from those that react to them.
Key takeaways
A cloud cost assessment is only as useful as the allocation model, tagging discipline, and unit economics framework behind it.
| Point | Details |
|---|---|
| Assessment covers four layers | Cost allocation, cost drivers, pricing models, and change analysis must all be examined together. |
| FinOps requires assessment as its foundation | Without attributed cost data, finance and engineering teams cannot align on priorities or trade-offs. |
| Unit economics reveal non-linear scaling | Cost per user or per request exposes inefficiencies that aggregate spend figures consistently hide. |
| Tagging discipline is non-negotiable | Automated tag enforcement is the only way to maintain assessment accuracy as environments scale. |
| Commitment drift corrupts chargeback models | Internal allocation rules must correct for Savings Plans and Reserved Instance attribution to preserve trust. |
Why accurate cloud cost assessment is harder than it looks
I have seen organisations invest in AWS Cost Explorer, set up tagging policies, and still produce cost reports that nobody trusts. The problem is almost never the tooling. It is the gap between the tag structure someone designed eighteen months ago and the organisational reality that exists today.
The teams that get this right share one characteristic: they treat cost taxonomy as a living document, not a one-time configuration. They review tag structures when products are renamed, when teams are reorganised, and when new services are adopted. That discipline sounds mundane, but it is what separates a cost assessment that drives decisions from one that generates arguments.
The other pattern I consistently observe is the underuse of unit economics. Most organisations stop at total spend by team or by service. The teams that find the largest savings go one level deeper and track cost per transaction, cost per active user, or cost per build. That granularity is what makes engineering trade-offs visible to finance, and financial constraints visible to engineering. It is the shared language that makes FinOps actually work in practice rather than in theory.
Automation and AI are accelerating what is possible here. Continuous monitoring platforms can now surface commitment drift, tagging gaps, and anomalous spend patterns in near real time, which means the assessment cycle no longer has to wait for the monthly invoice. That shift from reactive to proactive cost management is where the most significant financial gains are being found right now.
See your cloud costs clearly with Koritsu AI
Koritsu AI combines a continuous cost analysis platform with hands-on expert advice to give engineering and finance teams the attributed, actionable cost data they need. Our AI agent Kori surfaces where money is being lost across AWS, Google Cloud, and Azure, and our specialists help teams act on it. Clients start with a free cloud assessment and pay only from the savings we find. One UK bidding platform achieved a 52% reduction in cloud costs through this process. If your cost reports are generating more questions than answers, that is exactly the problem Koritsu AI is built to fix.
FAQ
What is a cloud cost assessment?
A cloud cost assessment is the structured analysis of cloud billing, usage, and pricing data to identify cost drivers, allocate spend to teams or products, and uncover optimisation opportunities. It covers cost allocation, pricing model analysis, and change detection across your cloud estate.
How does cloud cost assessment differ from cloud cost benchmarking?
Cloud cost assessment focuses on understanding your own internal costs and drivers. Cloud cost benchmarking compares those costs against industry standards or peer organisations to determine whether your spending is competitive.
What is a cloud cost impact assessment?
A cloud cost impact assessment evaluates the financial consequences of a specific change, such as a new architecture, a product launch, or a migration. It uses the baseline data from a standard cost assessment to model the before-and-after cost implications of a decision.
How often should you run a cloud cost assessment?
Cloud cost assessment should be a continuous practice rather than a periodic audit. Cloud environments change daily, and monthly billing cycles are too slow to catch commitment drift, tagging failures, or anomalous spend before they compound into significant budget overruns.
What is the biggest risk of skipping cloud cost assessment?
Without a structured assessment, cloud inefficiency reaches 30 to 35% of total enterprise cloud spend. Budget decisions made on aggregate invoices rather than attributed, granular data consistently underestimate costs and miss the largest optimisation opportunities.