FinOps Inform
Why engineering decisions affect cloud cost so directly
Discover how strategic engineering decisions can significantly reduce cloud costs by improving efficiency and optimizing resources.

Engineering decisions affect cloud cost because every architectural and operational choice you make gets billed, repeatedly, on a monthly invoice. The three levers that matter most are application efficiency; data and storage strategy; and service or infrastructure selection. A production-validated engineering framework cut annualised infrastructure cost significantly over the first two years, without breaching latency or availability targets. That is not a procurement win. It is an engineering outcome.
You do not need a finance transformation to start. You need a sprint.
This week, an engineering team can:
- Pull the top five services by spend and map each to its owning team.
- Check idle compute and unattached storage volumes for immediate deletion.
- Profile the two highest-traffic endpoints for obvious CPU or memory waste.
- Confirm autoscaling thresholds actually match real traffic, not guesswork.
- Set a retention policy on any log or telemetry stream with no defined lifespan.
Key Takeaways
Engineering decisions determine cloud cost because architecture, code efficiency, and data strategy convert directly into recurring, metered infrastructure charges.
| Point | Details |
|---|---|
| Three cost levers | Application efficiency, data and storage strategy, and service selection drive the majority of recurring cloud spend. |
| Measure cost per unit | Calculate cost per request or per customer to expose which teams and features actually drive spend. |
| Storage decisions compound | Retention, duplication, and telemetry cardinality multiply storage cost silently over months if left ungoverned. |
| Match service to duty cycle | Serverless suits bursty traffic; containers or VMs suit steady, high-volume workloads with flatter marginal cost. |
| Governance sustains savings | Policy-as-code and recurring FinOps rituals prevent optimisation gains from eroding after the first cleanup. |
| Engineering-led help available | Koritsu AI combines continuous AI-driven cost monitoring with hands-on FinOps specialists, charging only on realised savings. |
Why do design and implementation choices become recurring cloud spend?
Every architectural decision resolves into resources, and every resource resolves into a metered line item. Choose a stateful service and you commit to persistent storage costs for as long as that data lives. Choose cross-region replication and you commit to egress charges every time data crosses a boundary. Choose high-cardinality telemetry and you commit to ingestion and storage costs that scale with every new dimension you add to a metric.
The mistake most teams make is treating architecture reviews as a one-time design conversation rather than a recurring financial commitment.
Decisions that quietly compound into large bills:
- Adding a new database read replica “just in case” scaling is needed later.
- Logging every field on every request instead of sampling under load.
- Defaulting to multi-region active-active when a single region with failover would meet the actual SLA.
A practitioner analysis of AWS Well-Architected trade-offs found that architectural choices, not pricing negotiations, are what most reliably shift long-term spend. The invoice is downstream of the design document.
The three-pillar framework for mapping decisions to cost
Cloud cost is not one problem. It is three separate categories of decision, each with its own owner and its own review point.
| Pillar | What it drives | Where to apply it |
|---|---|---|
| Application | Compute hours, function invocations, memory allocation | Code review, profiling sprints |
| Data & storage | Storage bytes, retrieval fees, backup duplication | Design review, quarterly lifecycle audit |
| Service & infrastructure | Base capacity cost, managed feature premiums, elasticity waste | Architecture review, procurement decisions |
Each pillar has a natural checkpoint in the engineering lifecycle. Application efficiency belongs in code review and profiling. Data strategy belongs in the design document, before the schema is finalised. Service selection belongs in the architecture review, before you commit to a managed database that charges per read and write unit.
A useful mapping exercise:
- Caching decisions reduce backend request volume, which reduces compute and database load costs.
- Retention windows on logs reduce storage volume, which reduces both storage and query scan costs.
- Runtime choice affects cold-start frequency, which affects the effective cost per request under bursty traffic.
Run this mapping once per quarter, and the invoice stops being a surprise.
How do profiling and runtime choices change your compute bill?
Start with a number every engineer can calculate: cost per unit of meaningful work. That might be cost per 1,000 requests, cost per processed record, or cost per active user session. A cost-per-unit mental model turns a vague monthly total into something you can actually optimise, and teams applying it typically achieve forecasts reasonably close to actual spend.
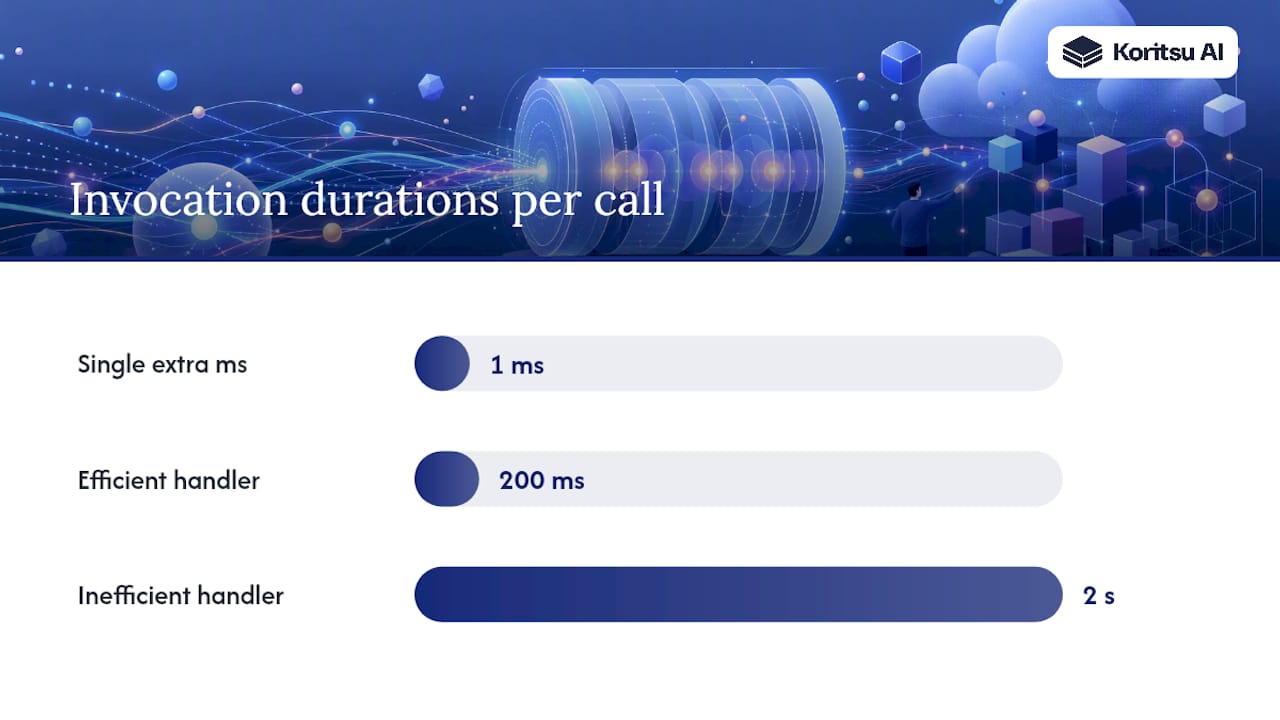
Profiling is where the real savings usually hide. Inefficient code does not just run slowly. It burns more compute hours, triggers more function invocations, and holds memory longer than it needs to. A function with an unnecessary synchronous database call inside a loop can turn a 200ms invocation into a 2-second one, and on a pay-per-execution model that is a tenfold cost increase for identical output.
Where to look first:
- CPU hotspots in request handlers that run on every call, not just edge cases.
- Memory allocation that is sized for peak load but running at that size 24 hours a day.
- Synchronous I/O calls that could be batched or made asynchronous.
- N+1 query patterns that multiply database round trips per request.
Concurrency and batching change the cost profile in a way that is easy to underestimate. Batching ten small writes into one reduces per-operation overhead, but it adds latency while the batch fills. That trade-off is legitimate, but it needs to be a decision, not a default. The same applies to runtime choice: a managed serverless runtime with a heavier cold start might cost more per invocation for latency-sensitive traffic, while the same runtime becomes cheap and appropriate for infrequent, bursty background jobs.
Track before-and-after metrics when you make these changes: requests per second at a given cost, and cost per 1,000 requests. If a refactor does not move that second number, it was not a cost optimisation, no matter how satisfying the code cleanup felt.
Pro Tip: Before optimising any function, calculate its cost per invocation using the provider’s published pricing for memory and duration. Most engineers are shocked by how much a single unnecessary millisecond costs at scale.
Why does data and storage strategy compound cost over time?
Storage is the pillar that punishes procrastination. A retention policy you never set does not fail loudly. It just keeps billing you, month after month, for data nobody reads.

Duplication makes this worse. Backups of backups, snapshots kept indefinitely, and staging environments that mirror production data all multiply storage volume without multiplying value. A dataset that costs £50 a month to store today can cost £600 a month in a year if nobody ever reviews it, simply because backup jobs keep running on schedule.
Tiering solves this if you actually use it. Hot data, accessed constantly, belongs on your fastest and most expensive tier. Warm data, accessed occasionally, can move to a cheaper tier with slightly higher latency. Cold data, rarely touched, belongs in archival storage where retrieval is slower but storage cost drops sharply.
Lifecycle policies worth setting today:
- Automatic tiering after 30 days of no access.
- Deletion rules for temporary and staging data after a fixed window.
- Backup retention capped at a defined number of restore points, not “forever.”
- Governance review of any exception to these rules, logged and time-boxed.
Telemetry deserves its own scrutiny. High-cardinality logging, where every request carries dozens of unique tags, generates ingestion and storage costs that scale with traffic and with every new dimension added. Aggregating metrics before storage, rather than storing every raw data point, achieves the same result for dashboards that do not need per-request granularity.
Which compute model actually fits your workload’s cost curve?
Every compute model has a different cost curve, and picking the wrong one is one of the most expensive engineering mistakes available. Serverless has low fixed cost and rising per-unit cost as invocation volume grows. Containers and virtual machines have a higher base cost but a flatter marginal cost as load increases. A FinOps-focused review of AWS architecture patterns makes the point plainly: the crossover between these curves depends entirely on duty cycle, and most teams never calculate where that crossover sits for their own workload.
| Workload pattern | Recommended model | Why |
|---|---|---|
| Bursty, infrequent traffic | Serverless | Low idle cost, no wasted capacity |
| Steady, high-volume traffic | Containers on reserved capacity | Flatter marginal cost beats per-invocation pricing |
| Latency-critical, constant load | VMs or dedicated containers | Predictable performance, no cold starts |
| Batch or overnight processing | Spot-equivalent instances | Interruption tolerance makes discount pricing viable |
Managed services shift the equation again. A managed database or managed cache removes operational burden, but it usually raises your resource floor, since you pay for the provider’s management layer on top of raw compute and storage. That premium is often worth it for a small platform team, and often not worth it once you have the in-house expertise to run the equivalent open-source service more cheaply at scale.
Pro Tip: Calculate your duty cycle before comparing prices.
How does network topology create unexpected cloud bills?
Egress fees are the cost that catches experienced engineers off guard, because they scale with success. The more traffic your application serves, the more it costs to move data out of the cloud provider’s network, and that cost rarely appears in early capacity planning.
Cross-region replication and multi-availability-zone designs exist for genuine resilience reasons, but they are not free redundancy. Every byte replicated across a region boundary is billed, and a design that replicates a full dataset to three regions for disaster recovery can triple your storage and transfer cost for a scenario that may never occur.
Where network cost hides:
- Chatty microservices that call each other across availability zones for every request.
- CDN configurations that cache too little, sending most traffic back to origin anyway.
- Multi-region active-active setups where a single-region failover would meet the actual recovery objective.
A content delivery network genuinely reduces origin cost when cache hit rates are high and content is reasonably static. It merely shifts expense when hit rates are low, because you are now paying for both the CDN and a mostly-unreduced volume of origin traffic. Model this by simulating expected data flows per unit of work, such as megabytes transferred per user session, rather than relying on provider-published averages that rarely match your actual traffic shape.
Rightsizing, autoscaling, and commitment strategy in practice
Rightsizing is the least glamorous cost lever and often the most effective one.
Autoscaling only works when it is tuned to real demand. A scaling policy triggered on CPU alone, with no cooldown period, tends to overreact and provision capacity that gets torn down and rebuilt within minutes, wasting both money and stability.
Autoscaling fundamentals worth revisiting:
- Choose a target metric that reflects actual demand, not a proxy that lags behind it.
- Set cooldown periods long enough to avoid thrashing between scale-up and scale-down.
- Size buffer capacity for realistic spike patterns, not worst-case theoretical load.
Reserved capacity and savings plans make sense once you have stable baseline usage you can commit to with confidence. Layer spot or interruptible instances on top for workloads that tolerate disruption, such as batch jobs or stateless worker pools, and keep autoscaling handling the variable portion above your reserved floor.
A safe rollout checklist:
- Confirm the workload can tolerate interruption before introducing spot capacity.
- Start commitments at a conservative baseline, below your lowest observed steady demand.
- Monitor spot interruption rates for two full weeks before expanding their share of capacity.
Pro Tip: Never commit to reserved capacity based on peak usage. Commit based on your lowest sustained baseline over the past quarter, and let autoscaling and spot handle everything above that line.
How do you build a cost-aware engineering culture?
Cost ownership only works when it sits with the teams making the decisions, not with a central finance function reading dashboards after the fact. The FinOps Foundation frames this as a cross-functional discipline where finance, engineering, and product share accountability rather than finance policing engineering after the invoice arrives.
Chargeback, where teams are billed directly for their consumption, creates the sharpest incentive but needs mature tagging and allocation to work fairly. Showback, where teams simply see their costs without being billed internally, is easier to implement and often sufficient to change behaviour once visibility exists.
Building the guardrails that make this stick:
- Policy-as-code that blocks common costly misconfigurations, such as unattached volumes or oversized default instance types, before they reach production.
- A recurring cost review as a standing agenda item in sprint planning, not an occasional audit.
- Cost impact as a required section in architecture and design review documents.
Embedding these guardrails into existing engineering processes, rather than bolting on a separate finance-only review, is what makes shift-left FinOps durable rather than a one-off cleanup exercise. A practical cloud spending governance framework gives teams a starting structure for this without reinventing it from scratch.
What should you measure, and which tools make it visible?
Cost visibility fails when it lives in a monthly PDF nobody reads. It succeeds when it lives inside the tools engineers already use every day.
The essential metrics are cost per unit (per request, per customer, per feature), utilisation percentages against your target band, and automated anomaly alerts for spend that deviates from a rolling baseline. Per-unit metrics do more than track spend. They expose which teams and features actually drive cost, turning an abstract budget conversation into a concrete engineering backlog item.
Where to surface this data:
- Native provider tools such as Azure Cost Management for allocation and budget tracking.
- Cost checks integrated into CI/CD pipelines, flagging infrastructure changes before merge.
- Cost annotations inside incident runbooks, so on-call engineers see the financial impact of a scaling decision in real time.
A well-configured automated cloud cost alert catches a runaway process within hours rather than at the end of a billing cycle.
Pro Tip: Add a cost estimate to your pull request template for any change touching infrastructure. Seeing the projected cost delta before merge changes engineering behaviour faster than any dashboard reviewed weeks later.
What timeline and savings should you expect from an engineering-led programme?
Most engineering-led cost programmes follow a recognisable arc: an assessment phase to establish baseline visibility, a quick-wins phase targeting obvious waste, an automation phase embedding guardrails, and an ongoing governance phase that never really ends.
Savings vary by scale, statefulness, and how much data growth has gone unmanaged. A workload with years of unreviewed storage and no autoscaling tends to see steeper early gains than a system that has already had one optimisation pass.
| Milestone | Typical focus | Expected outcome |
|---|---|---|
| 30 days | Assessment, tagging, quick wins | Idle resource removal, initial visibility |
| 30 days | Rightsizing, autoscaling tuning | Meaningful reduction in compute waste |
| — | Automation, policy-as-code, governance | Sustained savings with guardrails preventing regression |
What drives the variance between engagements:
- Systems with heavy statefulness take longer to optimise safely than stateless services.
- Data growth left unmanaged for years produces larger, slower-to-realise storage savings.
- Teams with existing observability move through the assessment phase faster.
What does a real engineering-led savings programme look like?
The most convincing evidence for this approach is not a vendor claim. It is measured outcome. A production-validated cloud cost optimisation framework, applied across a multi-account, multi-region healthcare platform, reduced annualised infrastructure cost by approximately 18% in the first year and a further 5% in the second, while keeping availability and latency within established service-level objectives throughout.
The programme’s repeatable elements were not exotic. They were rightsizing based on measured utilisation, demand-aware autoscaling, storage lifecycle policies enforced automatically, and policy-as-code guardrails preventing common misconfigurations from reaching production. Continuous governance, rather than a one-time cleanup, kept the second-year savings from eroding.
What engineering teams can take from this directly:
- Sustained savings come from process changes embedded into daily engineering work, not from a single audit.
- Availability and latency do not need to suffer for cost to fall; the case shows both held steady.
- Year-two savings prove that governance, not just initial effort, determines whether gains last.
That second point matters more than the headline percentage.
How do you map invoices back to the workloads that generate them?
You cannot optimise what you cannot attribute. Most cloud bills arrive as an undifferentiated wall of line items, and the first engineering task is turning that into a per-workload, per-team view.
Consistent tagging is the foundation: every resource tagged by team, service, and environment at creation time, enforced through policy rather than convention. Without this, cost allocation becomes archaeology, reconstructing ownership months after the fact from resource names and best guesses.
Cost-per-metric takes this further by tying spend to a business-meaningful unit rather than a raw dollar figure. Cost per active user, cost per transaction processed, or cost per feature deployed turns a finance conversation into an engineering one, because engineers can act on a metric tied to something they control.
Building this visibility in practice:
- Enforce mandatory tagging at resource creation through infrastructure-as-code templates, not manual entry.
- Build a dashboard that maps spend to service ownership, refreshed daily rather than monthly.
- Calculate cost per unit for your three highest-spend services first, then expand coverage.
Cloud observability platforms that link performance metrics to spend data close the loop between “this service is slow” and “this service is expensive,” which are very often the same underlying problem.
Does stateful or stateless design change your cost trajectory?
Stateless services are cheaper to scale because any instance can handle any request, letting autoscaling add and remove capacity freely without coordination overhead. Stateful services carry data with them, which means scaling requires replicating or migrating that state, and that process itself consumes compute and network resources.
The cost difference shows up most clearly during scale-down. A stateless service can shed capacity the moment demand drops. A stateful service, particularly one holding session data or an in-memory cache, often has to drain connections or migrate state before an instance can be safely removed, which delays cost savings during quiet periods.
This does not make stateful design wrong. Databases, for instance, are inherently stateful, and pretending otherwise creates worse problems than the cost it saves. The engineering discipline is in isolating state to the smallest possible footprint and keeping everything else stateless. A common pattern separates a stateless application tier, which scales cheaply and quickly, from a stateful data tier, which scales deliberately and with more caution.
Practical guidance for managing this trade-off:
- Push session state into an external store (such as a managed cache) rather than holding it in application memory.
- Keep stateful components on a slower, more conservative scaling policy than stateless components.
- Measure scale-down latency for stateful services separately, since it directly affects cost during low-traffic windows.
Get this separation wrong and you end up paying for the peak-load footprint of your stateful tier around the clock, even when the stateless tier in front of it has already scaled down.
What do consistency models cost in a distributed system?
Strong consistency, where every read reflects the most recent write, generally costs more than eventual consistency, where reads can briefly return stale data. The cost shows up as coordination overhead: consensus protocols, cross-region locking, and synchronous replication all consume compute and network resources that an eventually consistent system avoids.
Cross-region strongly consistent systems pay this cost most visibly, because achieving consensus across geographic distance adds both latency and the network transfer charges that come with cross-region traffic. A system that could tolerate eventual consistency, but is built strongly consistent anyway, is paying a permanent tax for a guarantee it does not actually need.
The right question is not “which model is better” but “which parts of this system actually need strong consistency.” A financial ledger balance almost certainly does. A view count on a social media post almost certainly does not. Mixing models within a single system, strong where correctness demands it and eventual where it does not, is usually cheaper than applying one consistency guarantee uniformly across an entire platform.
Where this trade-off plays out in real systems:
- Payment and inventory systems typically justify the cost of strong consistency.
- Analytics, recommendation, and social features usually tolerate eventual consistency without issue.
- Read replicas with eventual consistency reduce load on a primary database, cutting both compute and licensing cost where applicable.
Treat consistency as a per-component decision made during design review, not a platform-wide default inherited from whatever database was chosen first.
How do caching strategies reduce your backend costs?
Caching is one of the highest-leverage cost decisions available, because every cached request is a request your backend never has to process. That translates directly into lower compute costs, fewer database read operations, and in many cases lower egress, since a cache closer to the user often serves data more cheaply than a round trip to origin.
The mechanism is straightforward: a cache absorbs repeat reads for data that does not change on every request. A product catalogue, a user’s profile information, or a frequently accessed configuration value are all strong caching candidates because they change far less often than they are read.
The risk is over-caching data that needs to be fresh, or under-caching data that would benefit enormously from it.
Where caching typically delivers the strongest return:
- Read-heavy endpoints with infrequently changing data, cached at the application or edge layer.
- Expensive computed results (aggregations, reports) cached rather than recalculated on every request.
- Database query results for common lookups, reducing load on the primary database tier.
Measure the reduction in backend load directly, not just the presence of a cache. A cache with a low hit rate adds operational complexity and its own infrastructure cost without meaningfully reducing backend spend, which makes it a net cost increase rather than a saving.
How much does logging granularity actually cost you?
Telemetry is the cost category engineers underestimate most consistently, because the bill arrives as a storage and ingestion line item, disconnected from the logging decision made months earlier in a code review.
Every log line, every custom metric dimension, and every trace span has a cost, and that cost scales with traffic. A service handling 10 million requests a day that logs five fields per request generates 50 million data points daily.
High-cardinality dimensions are the sharpest cost multiplier. A metric tagged by user ID, rather than by user tier or region, can multiply the number of unique time series by orders of magnitude, and most metrics platforms price on cardinality directly.
Practical controls that keep telemetry cost proportionate:
- Sample routine, successful requests at a fraction of volume; log 100% of errors and anomalies.
- Aggregate metrics before storage where per-request granularity is not genuinely needed for debugging.
- Set retention windows on logs separately from metrics, since debugging rarely needs logs older than a few weeks.
- Review high-cardinality tags quarterly and remove any that have never been used in an actual investigation.
A cloud observability primer built for engineers covers how to keep this signal-rich without letting ingestion costs grow unchecked.
Do encryption and access controls raise your cloud bill?
Security design choices carry real, measurable cost, though the amounts are usually modest compared with the architectural levers already covered. Encryption at rest and in transit adds a small compute overhead for encryption and decryption operations, and managed key management services typically charge per key and per API call.
The bigger cost driver is usually architectural rather than cryptographic. Fine-grained access control, implemented through numerous small services or strict network segmentation, can increase the number of components in a system, and each additional component carries its own baseline infrastructure cost. This is part of what one analysis of system complexity calls the architecture tax: decomposing a system for security or organisational reasons increases coordination, maintenance, and infrastructure cost, even when each individual piece is cheap.
None of this argues for weaker security to save money. It argues for being deliberate about where complexity earns its cost. A single well-audited access control layer is usually cheaper and more secure than a dozen overlapping, loosely coordinated ones.
Where security cost is worth scrutinising:
- Key management API call volume, which scales with how often your application encrypts or decrypts data.
- The number of network boundaries and security groups, since each adds both configuration and monitoring overhead.
- Audit logging retention for compliance, which follows the same telemetry cost logic covered earlier.
Encryption itself is rarely the expensive part. The infrastructure built around enforcing access controls usually is.
Prioritising cost work without breaking reliability
Start with the changes that cost nothing to reverse: idle resource cleanup, rightsizing based on real utilisation, and telemetry sampling. Save architectural changes, service migrations, and consistency model shifts for a deliberate review, because those carry genuine reliability risk if rushed.
Keep an explicit trade-off register. Every time cost, reliability, and security pull in different directions, write down which one you chose to prioritise and why. It stops the same argument recurring every quarter and gives future engineers the reasoning, not just the decision.
Buy-in comes from evidence, not mandates. Show one team a genuine before-and-after number from their own service, and the next design review will include a cost line without anyone asking for it.
How Koritsu AI turns these principles into measurable savings
Everything above works because it treats cloud cost as an engineering problem, not an accounting one, and that is exactly the premise Koritsu AI is built on. Our AI agent, Kori, runs continuous analysis across your cloud spend, surfacing exactly which services, teams, and code paths are driving the bill, while our FinOps specialists work directly with your engineers to fix the root causes rather than just flag them.

Two things make this practical for an engineering leader weighing where to spend limited time. First, the savings are measurable against your actual billing, not estimated against a benchmark. Second, the recommendations arrive in a form engineers can act on directly, tied to specific services and configurations, rather than a generic report that sits in a shared drive.
We only charge when we deliver: a free assessment first, then a share of the savings we actually find, with an optional ongoing subscription once the quick wins are done. Our AWS Lambda cost reduction case shows a 96% bill reduction for a financial services group’s serverless workload, and our UK bidding platform case shows a 52% infrastructure cost reduction achieved through the same engineering-led approach covered in this guide. If your team recognises any of the patterns above in your own architecture, start with a free FinOps assessment and see what Kori finds in your billing data.
Sources
For deeper technical grounding, read the production case study on engineering-driven cloud cost optimisation for measured, SLO-preserving results, and explore FinOps Foundation resources for cross-functional cost ownership frameworks.
Recommended next steps:
- Engineering-Driven Cloud Cost Optimization at Enterprise Scale: An Applied Success Story with Measured Outcomes in a Large Healthcare Enterprise
- FinOps Foundation
- Chapter 1: Why engineers struggle to estimate cloud costs (and the mental model that fixes it)
- Million-Dollar Lines of Code: Embracing shift-left FinOps and engineering-led cloud optimization